

Overview
System Monitor gives Operators a live view of host-resource pressure and AI model-serving activity. Use it to spot CPU, memory, disk, GPU, or inference-queue pressure while the platform is running. The page is available from Backoffice > Platform > System Monitor when the System Monitor feature is enabled.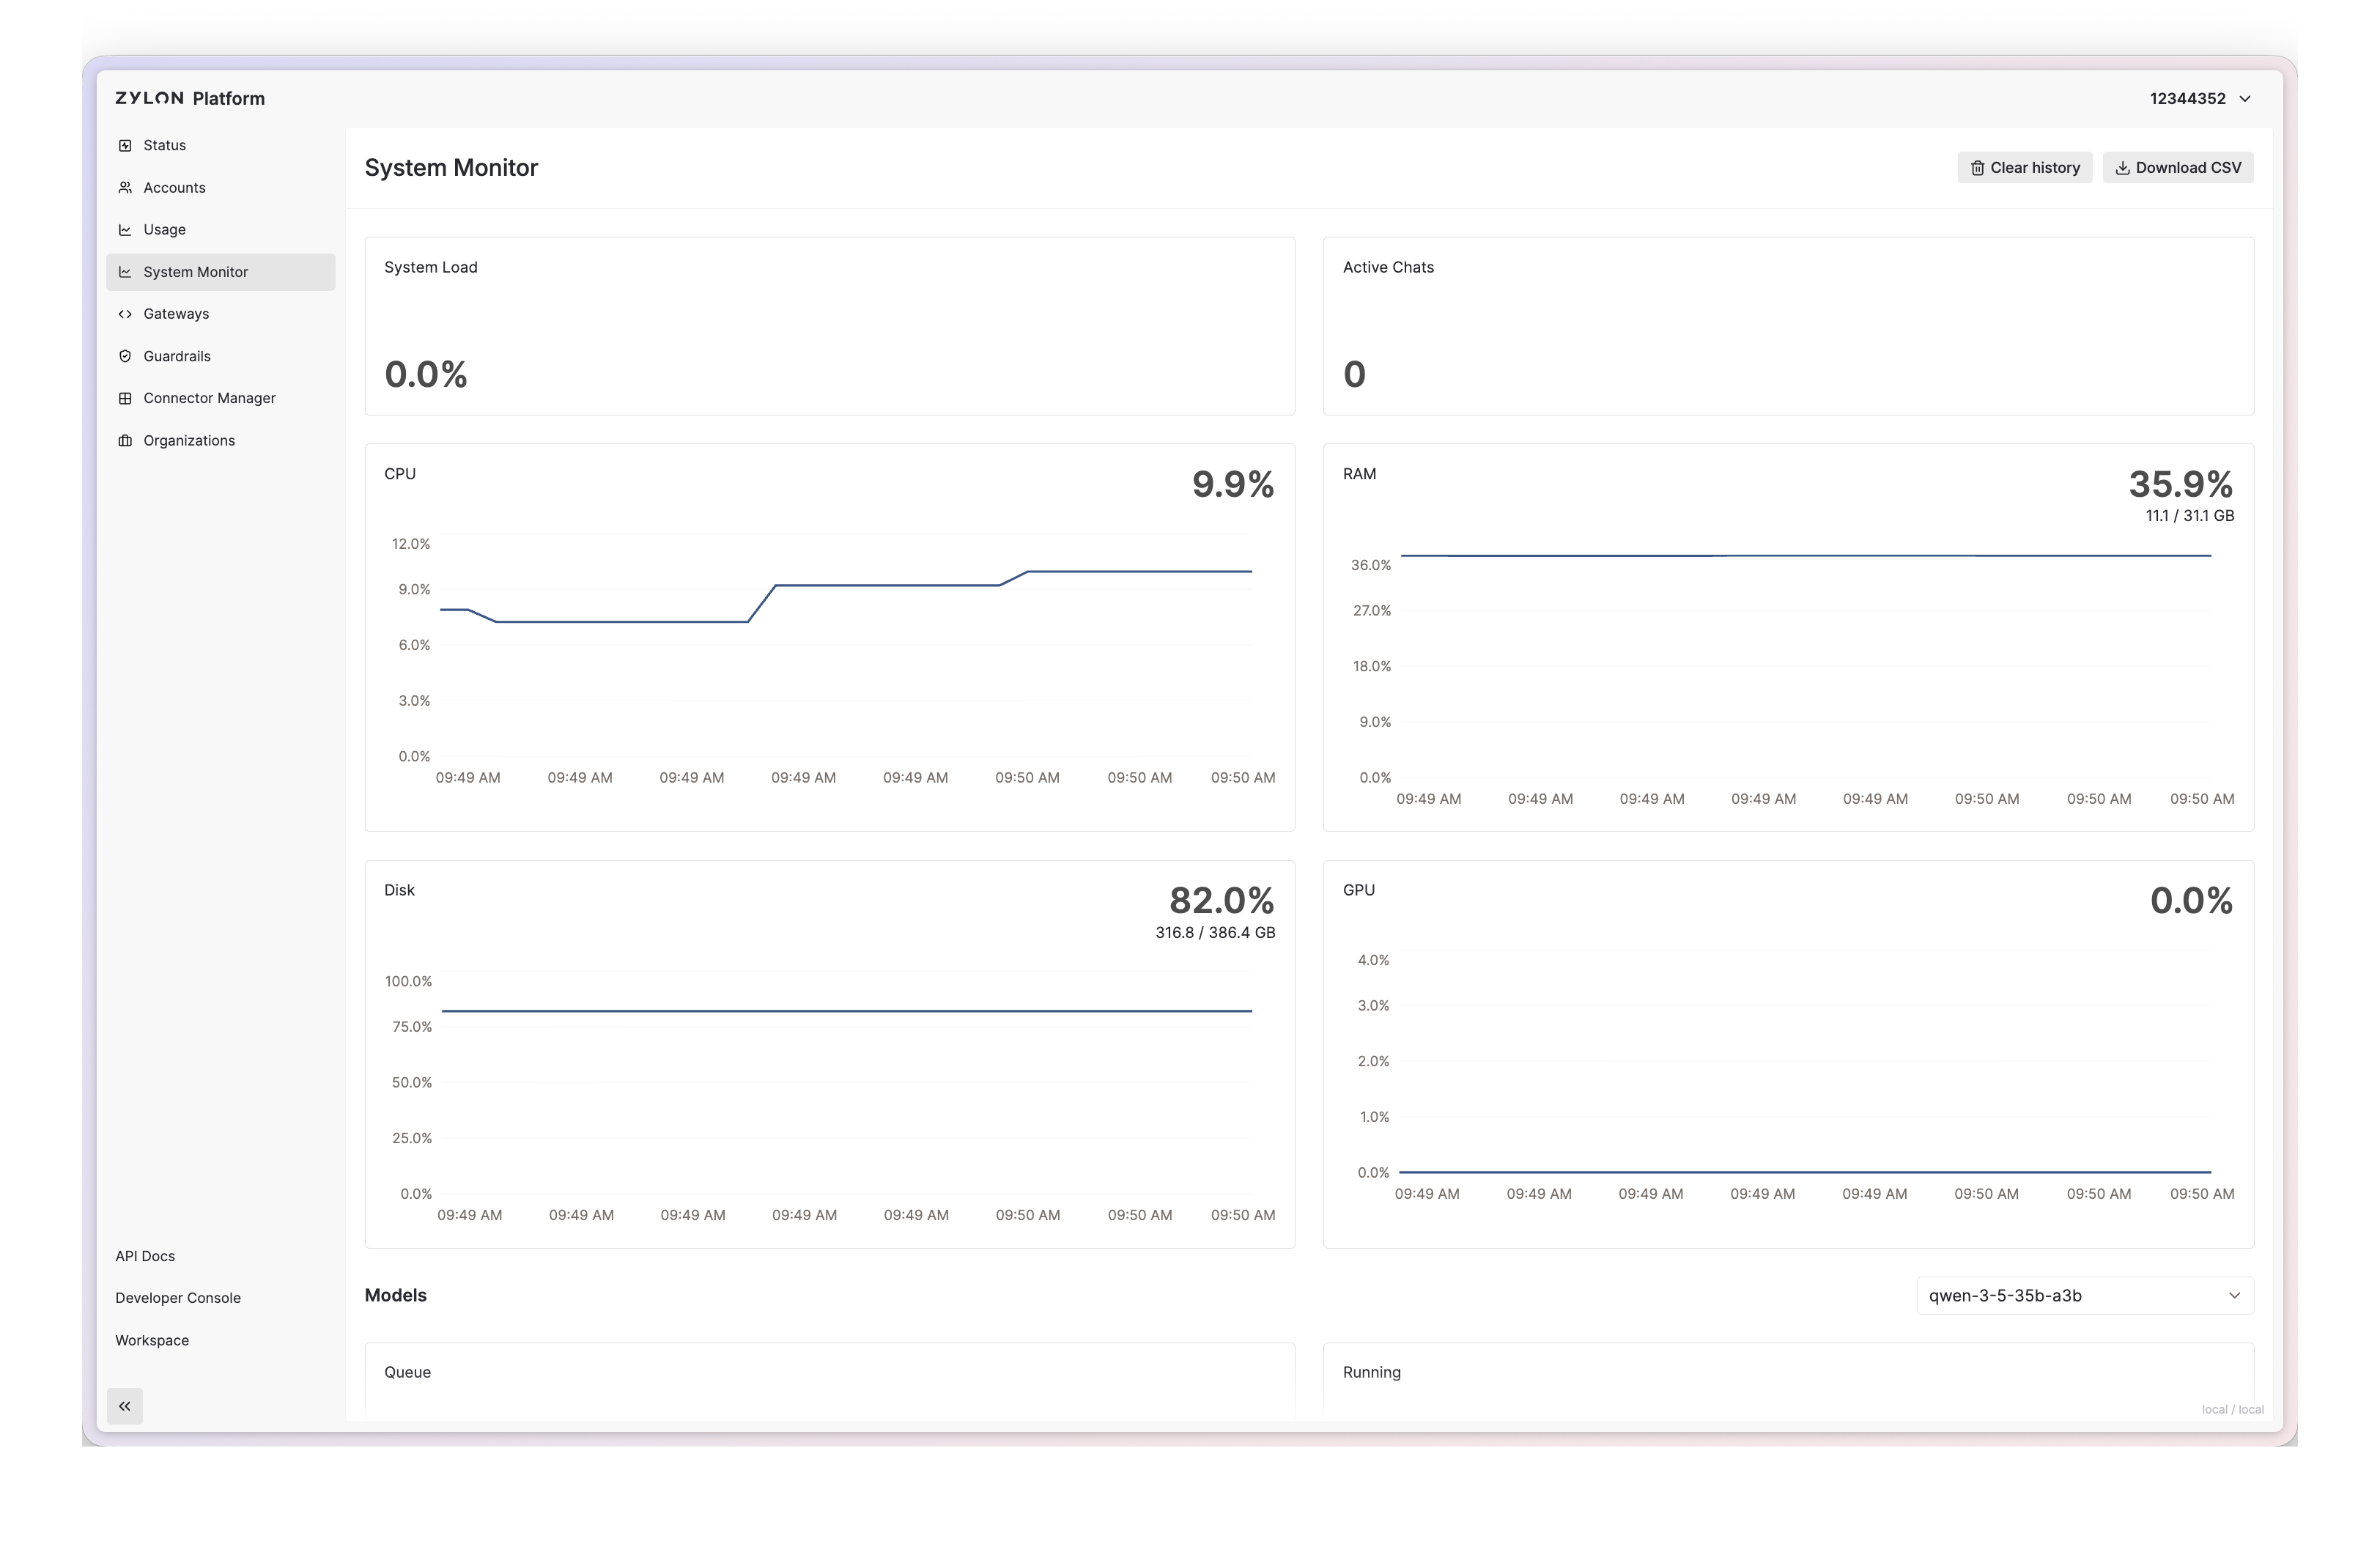
The exact layout can vary between Zylon versions.
Available information
Metrics update once per second. Charts keep the latest 30 samples, including recent samples replayed when the page opens.System metrics
Model metrics
Select a loaded model to inspect:Data sources and limitations
- CPU and RAM come from Kubernetes node metrics when available, with host-level readings as a fallback.
- Disk usage covers the filesystem containing
/var/zylon. - GPU, VRAM, and model-serving data come from the Triton Prometheus metrics endpoint.
- Per-model GPU metrics depend on process-level GPU metrics. Deployments that do not expose them show zero values.
- The page is a live operational view, not persistent historical reporting. Reloading it requests the latest available samples again.
- System Load is an instantaneous display signal. Request-overload protection additionally considers sustained resource usage and deployment thresholds.