Zylon comes with a built-in Kubernetes Dashboard,
which will help you monitor and diagnose issues with your installation.
To enable it, you will need to edit your config file at /etc/zylon/zylon-conf.yaml and add the following section:
adminDashboard:
  enabled: true
  exposeIngress: true
https://<zylon.company.com>/kube-dashboard
To login, you can generate a short-lived token:
kubectl -n zylon create token zylon
kubectl get secret zylon-token -n zylon -o jsonpath='{.data.token}' | base64 -d
The permanent token will provide full admin access to your Kubernetes cluster.
Keep it secret and secure.
Zylon uses multiple namespaces, you can check the status of each.
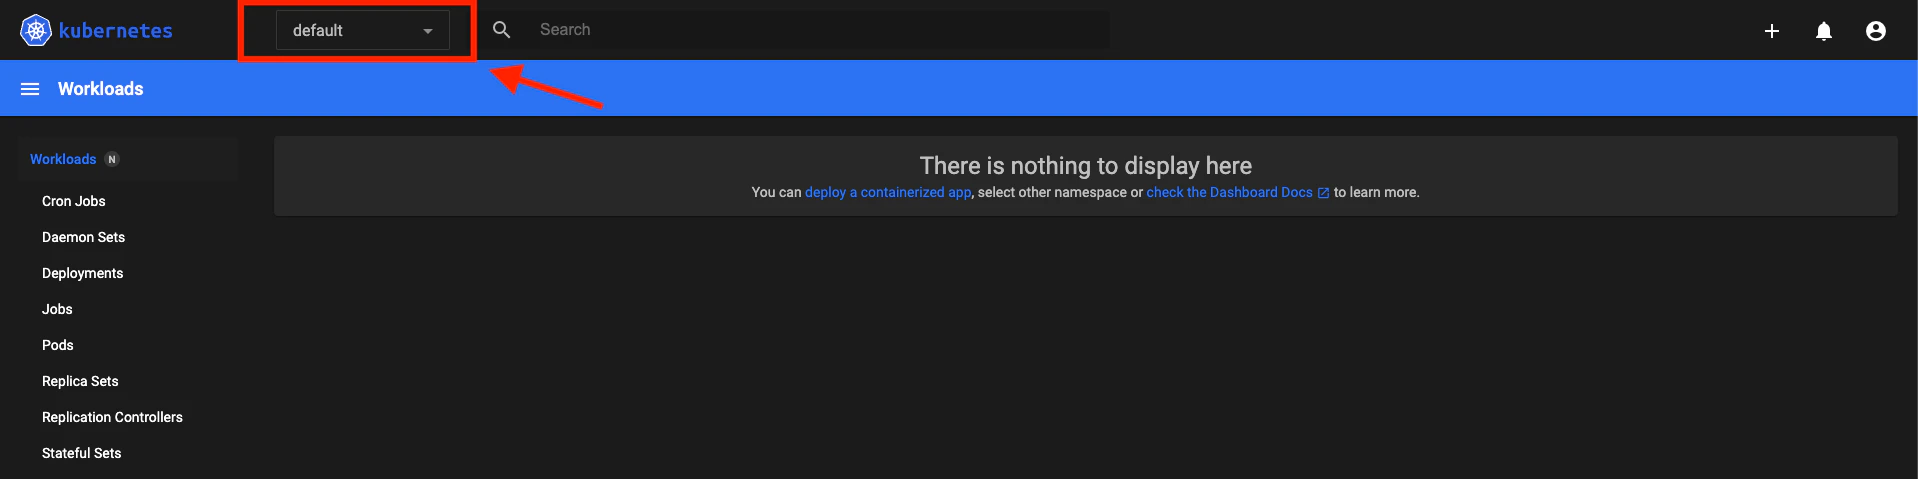
Select the right namespace from the dropdown on the top left corner.
- zylon: Zylon system components
- openebs: OpenEBS storage system
- nvidia: NVIDIA controller and device plugin
- Pods
- Logs
- Basic metrics regarding CPU and memory usage
Frequent Questions
This section explains how to navigate the Kubernetes Dashboard to investigate common issues in your Zylon installation.
❓ Where do I start when something is not working?
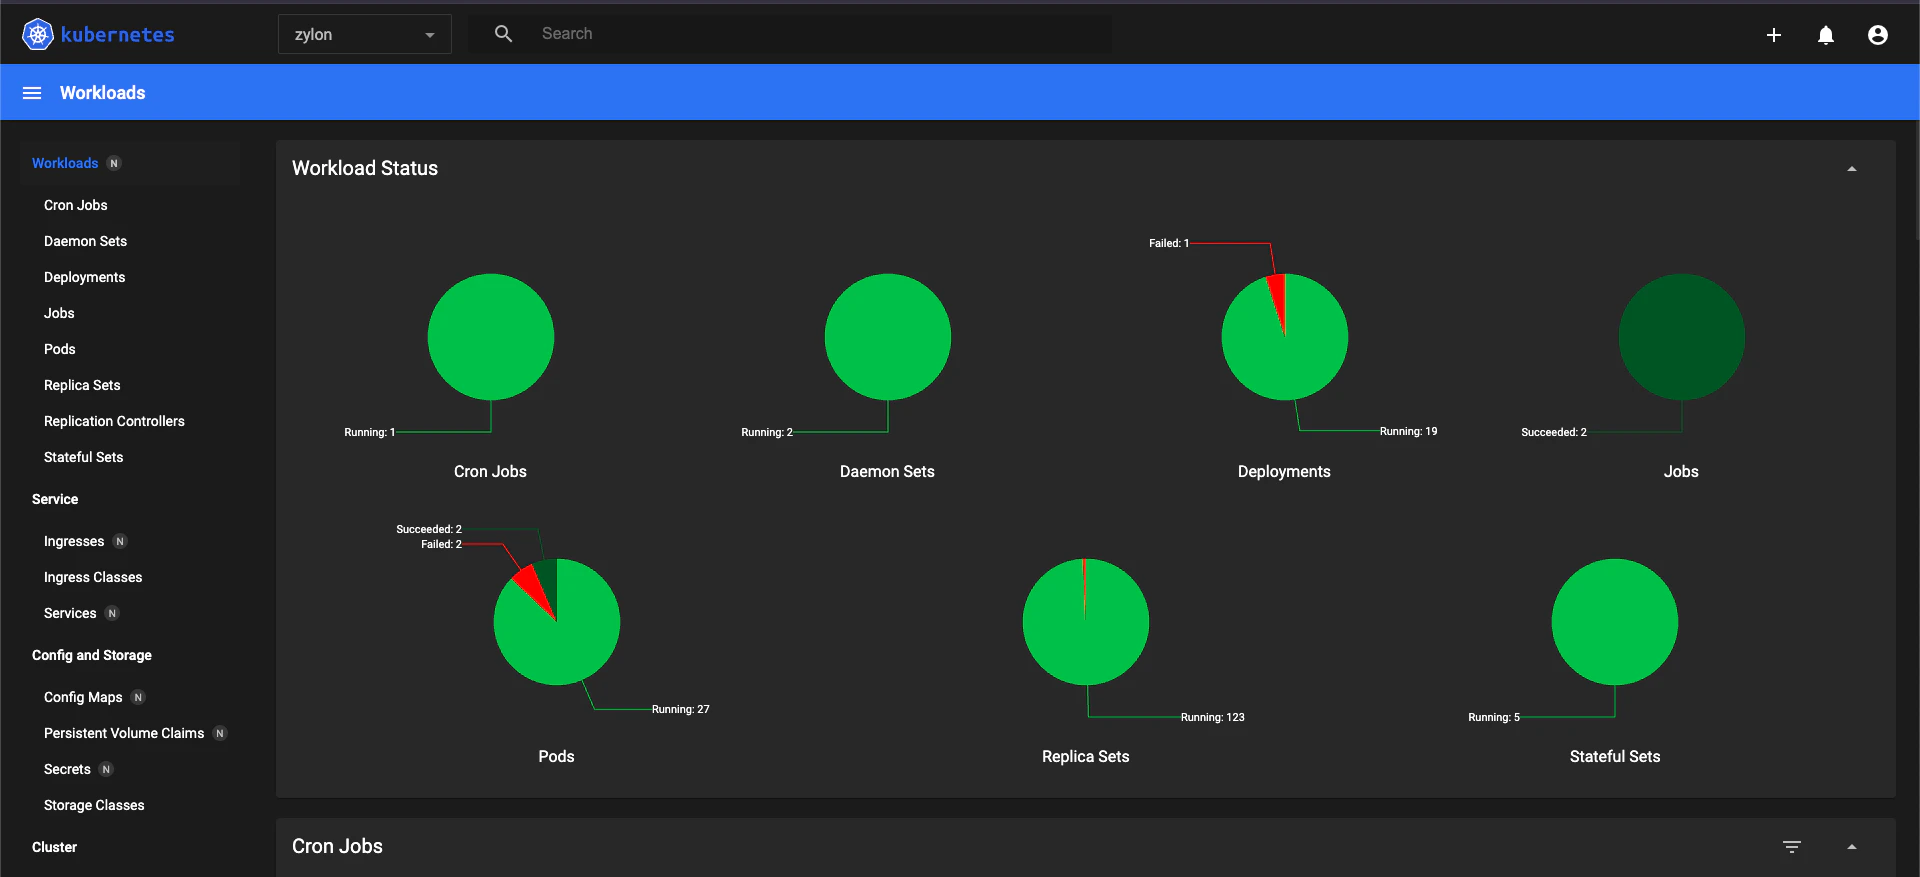
When you first open the Kubernetes Dashboard, you’ll see a high-level overview of your workloads and cluster health.
This view shows the current status of running resources such as Pods, Deployments, and basic CPU/memory usage.
❓ Which namespace should I select?
Zylon uses multiple namespaces, but most workspace and platform issues will be in the zylon namespace.
- Open the namespace dropdown in the top-left corner of the dashboard
- Select the namespace you want to check
- The dashboard will refresh and show only that namespace’s system components
This helps reduce noise and ensures you are inspecting the correct resources.
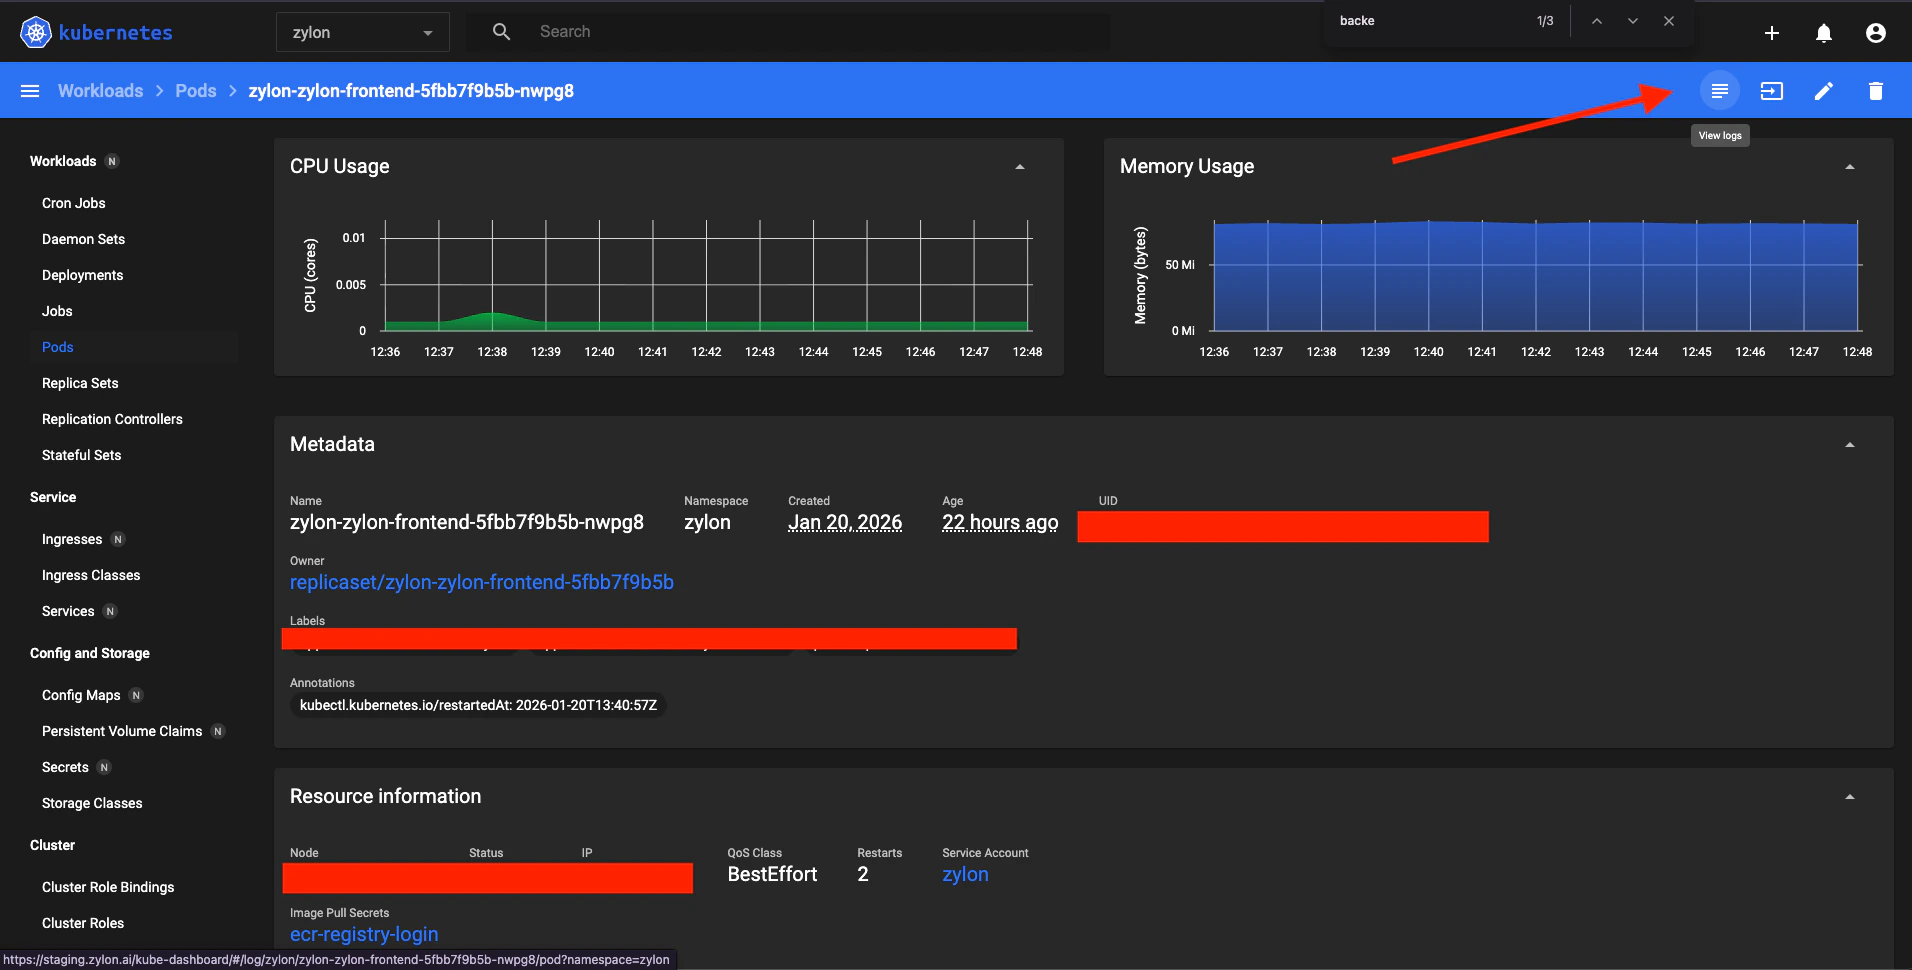
❓ How do I view logs for a Pod?
To inspect logs for a specific Pod:
- Click on the Pod name you want to investigate
- This opens the Pod details page with:
- Status
- Events
- Resource usage
- Containers
- In the top-right corner, click Logs
 You can:
- View live logs
- Download logs for offline analysis if your instance is airgap
Logs are usually the fastest way to identify configuration errors, startup failures, or runtime issues.