- service health
- throughput and failures
- latency analysis
- scheduler and GPU bottlenecks
What you need first
Before this dashboard is useful, you need:- platform metrics enabled in Zylon
- a Prometheus-compatible metrics backend with Zylon metrics in it
- a Grafana instance with a Prometheus datasource connected to that backend
Import the dashboard
Download grafana-dashboard.json and import it in your Grafana instance through Dashboards → New → Import. For the Grafana import flow, see the Grafana import dashboards documentation.What the dashboard shows
The dashboard is built from the metrics exposed on the Triton/metrics endpoint:
- Triton Inference Server metrics such as request counts, latency, queue depth, and GPU health
- vLLM metrics such as scheduler state, KV cache use, token throughput, and latency histograms
Dashboard filters
Reading the dashboard
Follow this order when investigating an issue:Panels by section
Overview
Quick health indicators for success rate, requests per second, concurrent requests, and queue depth.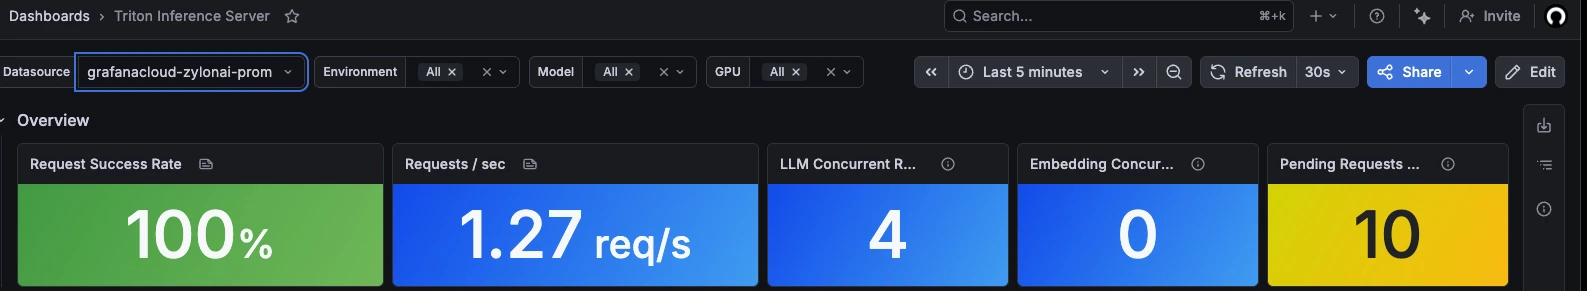
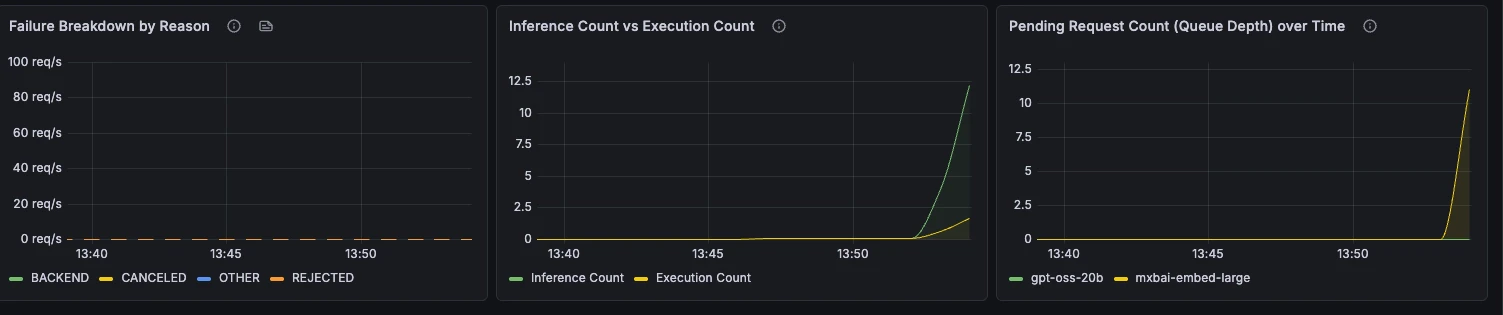
Throughput & Errors
Request rate, failure rate, failure reasons, batching behaviour, and queue depth over time.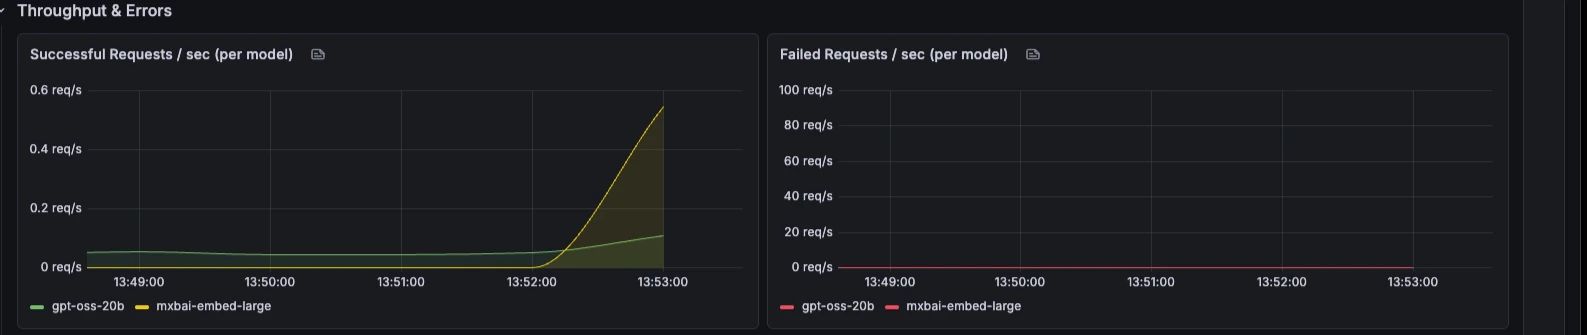
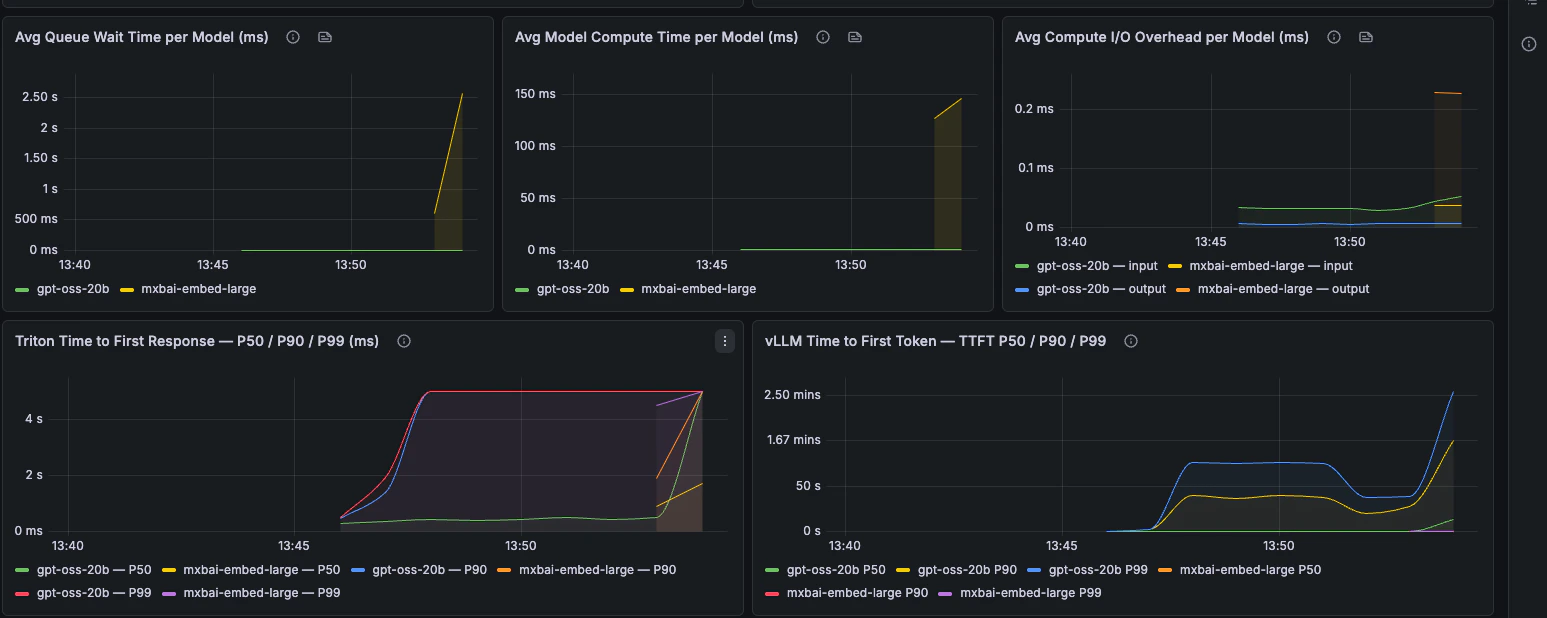
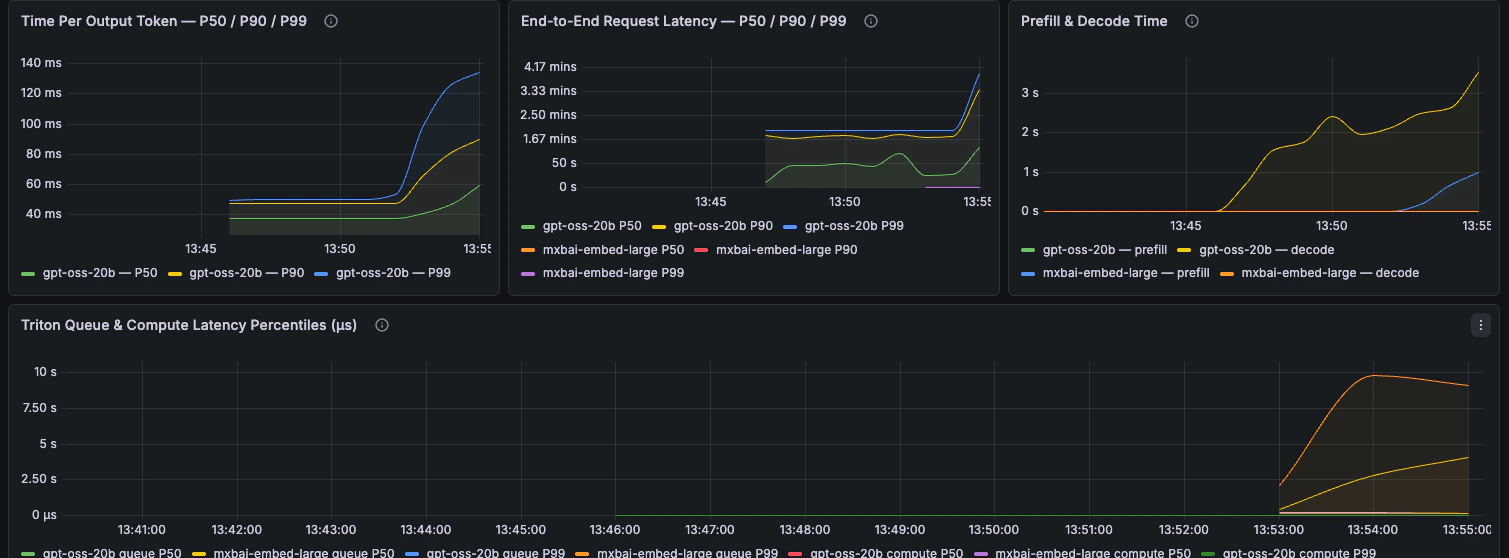
Latency
End-to-end latency, phase breakdown, TTFT, TPOT, and request latency percentiles.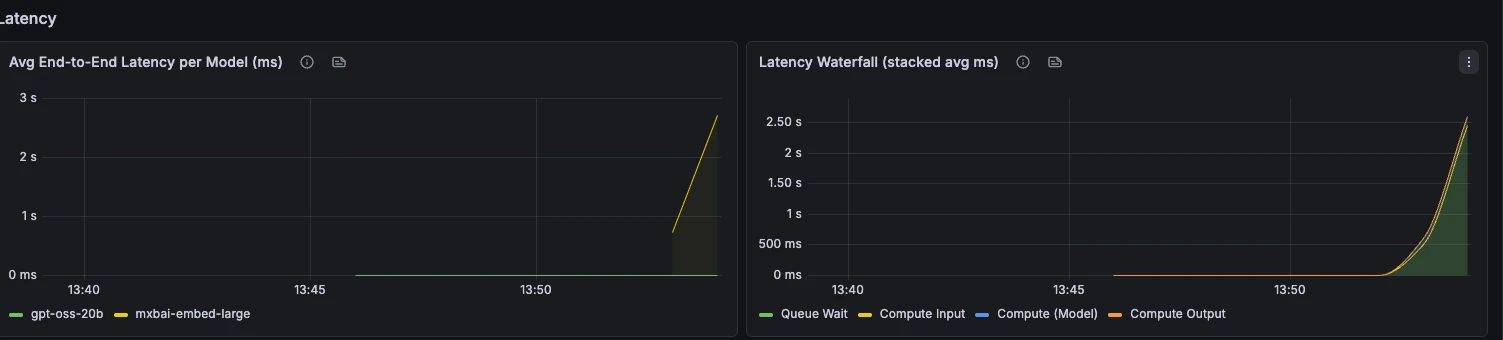
Capacity & Scheduler
Scheduler state, queue time, KV cache utilisation, preemptions, and batch size.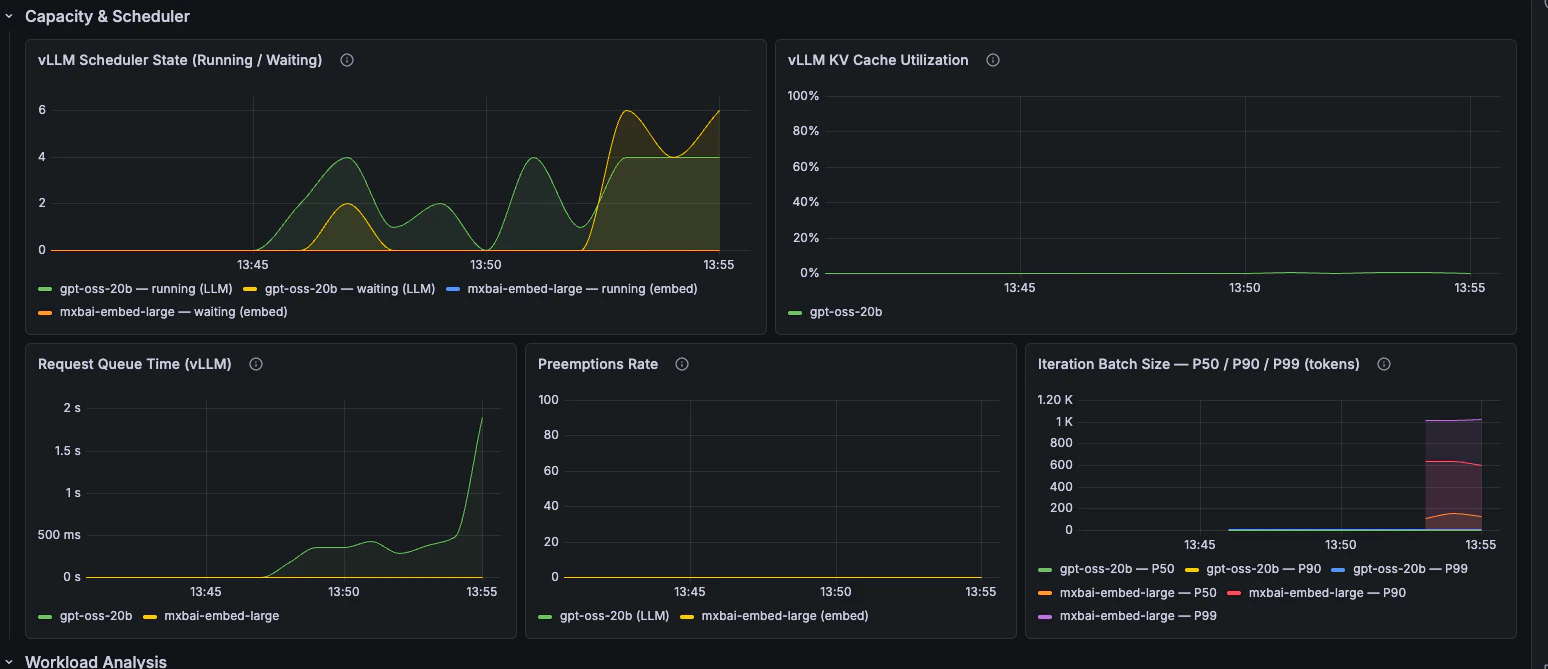
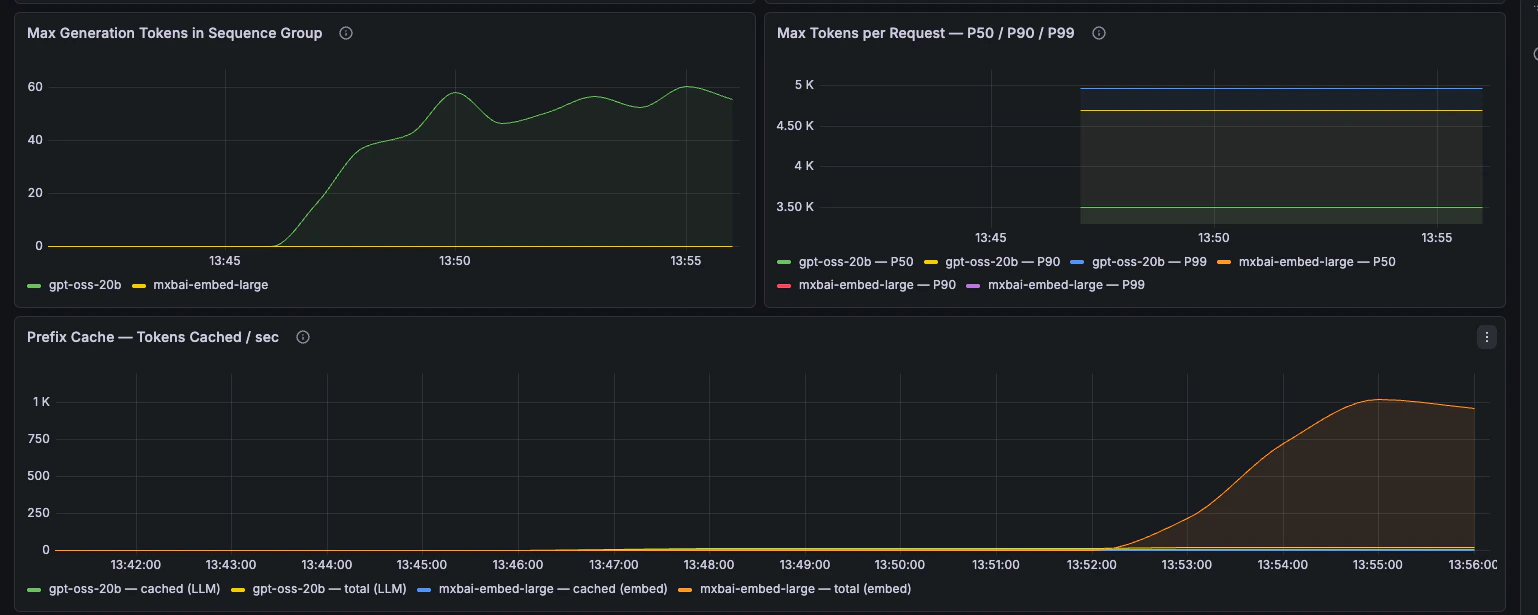
Workload Analysis
Token throughput, prompt length, generation length, and prefix-cache behaviour.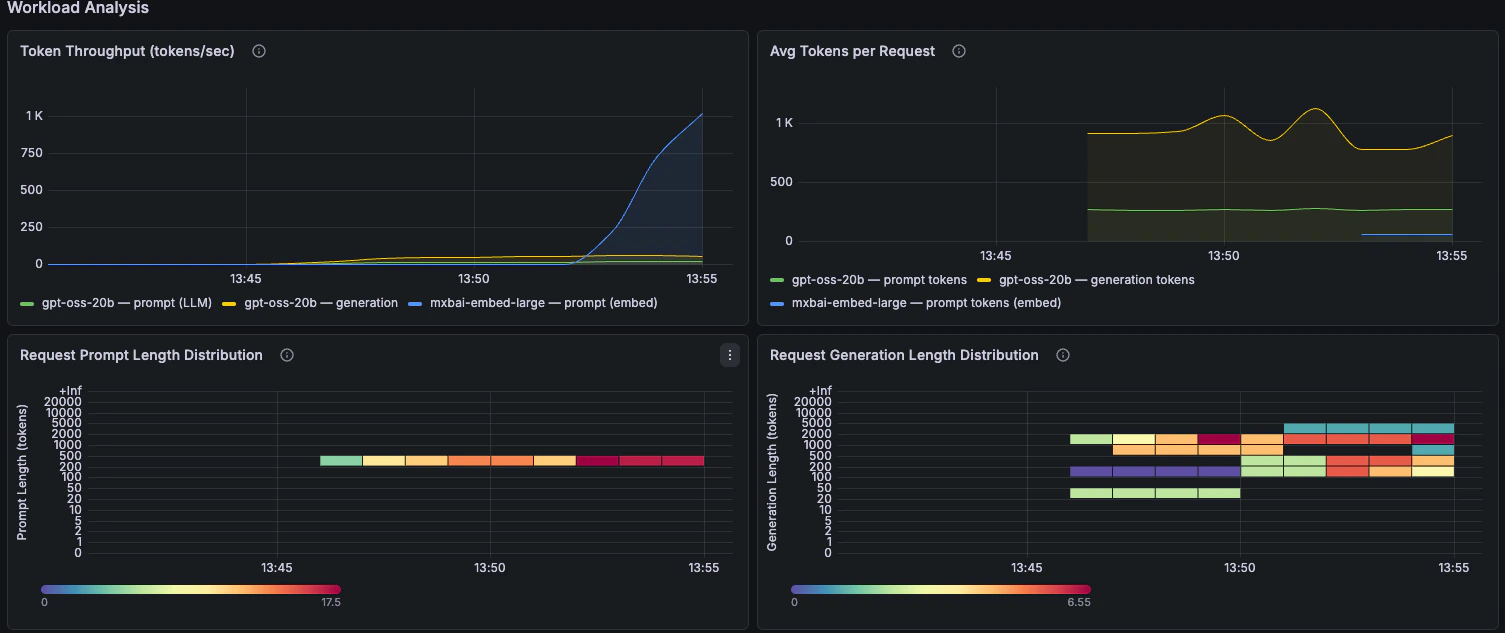
GPU Health
GPU utilisation, memory pressure, power draw, and energy consumption.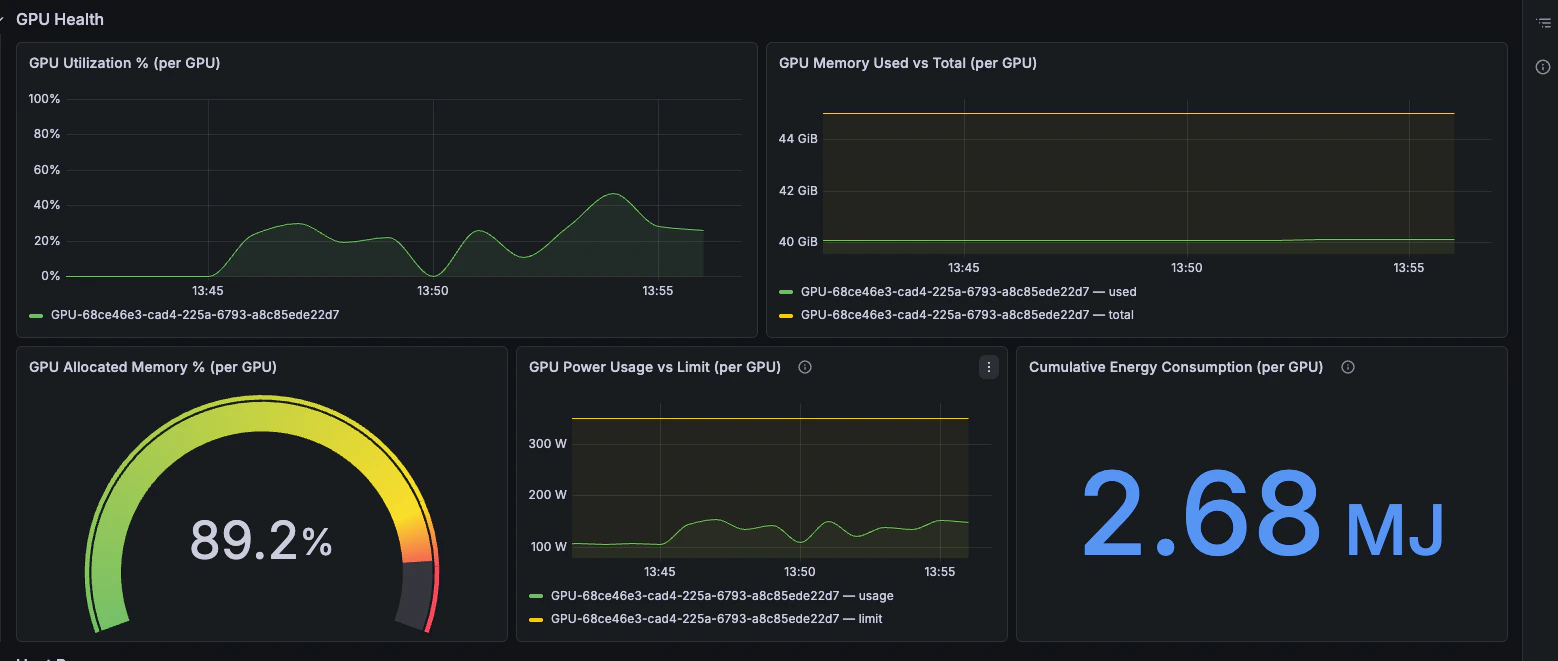
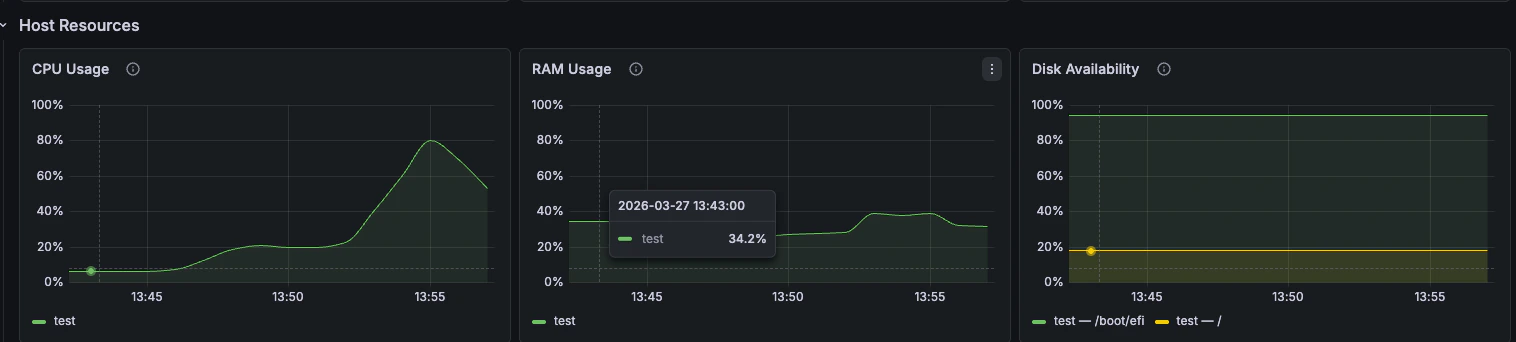
Host Resources
CPU, RAM, and disk availability fromnode_exporter.