

What you can see
- Activity across the workspace (e.g., queries, chats, projects, AI Documents, documents linked).
- Temporal views: how people is engaging over time.
- Top users and projects list of top N users and projects via dropdown.
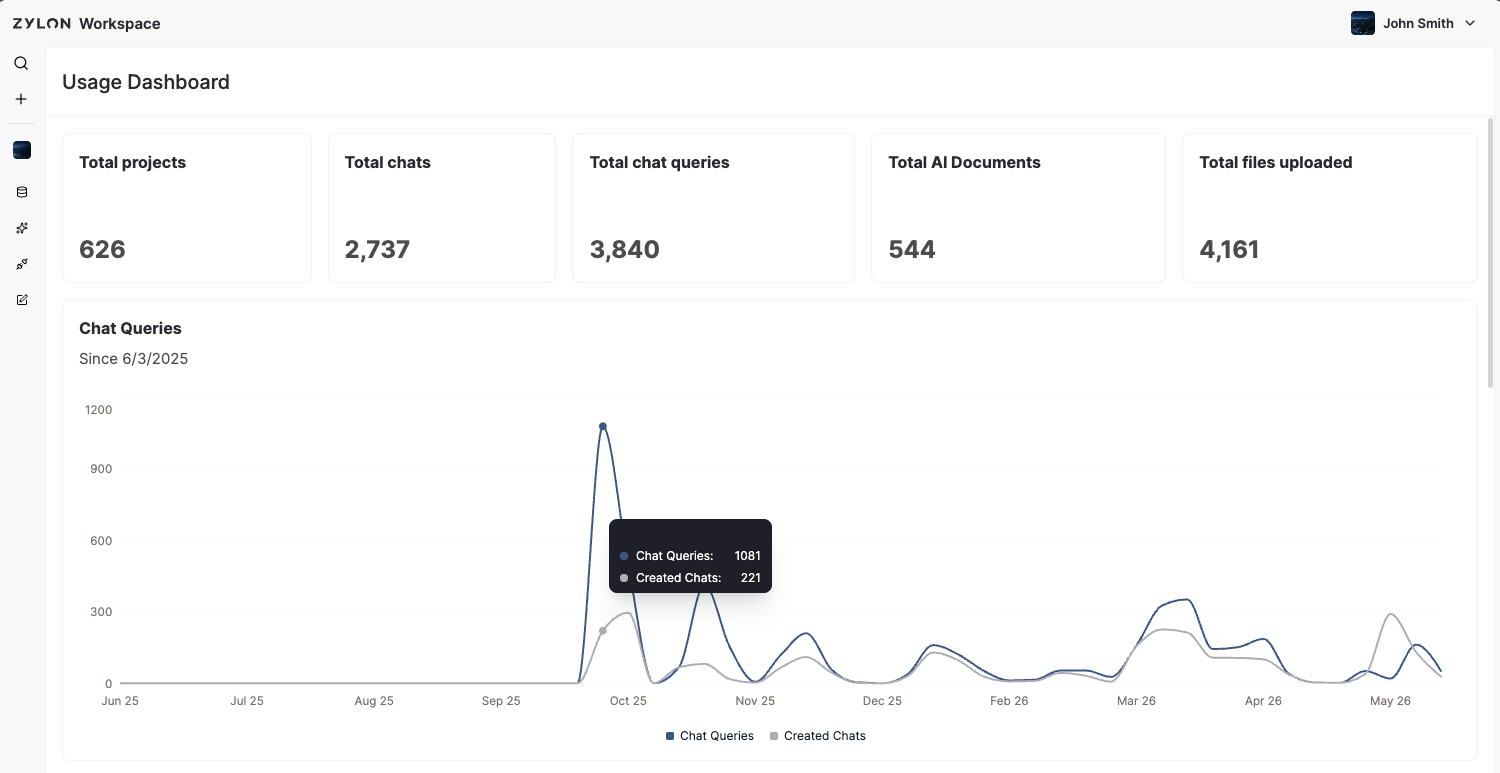
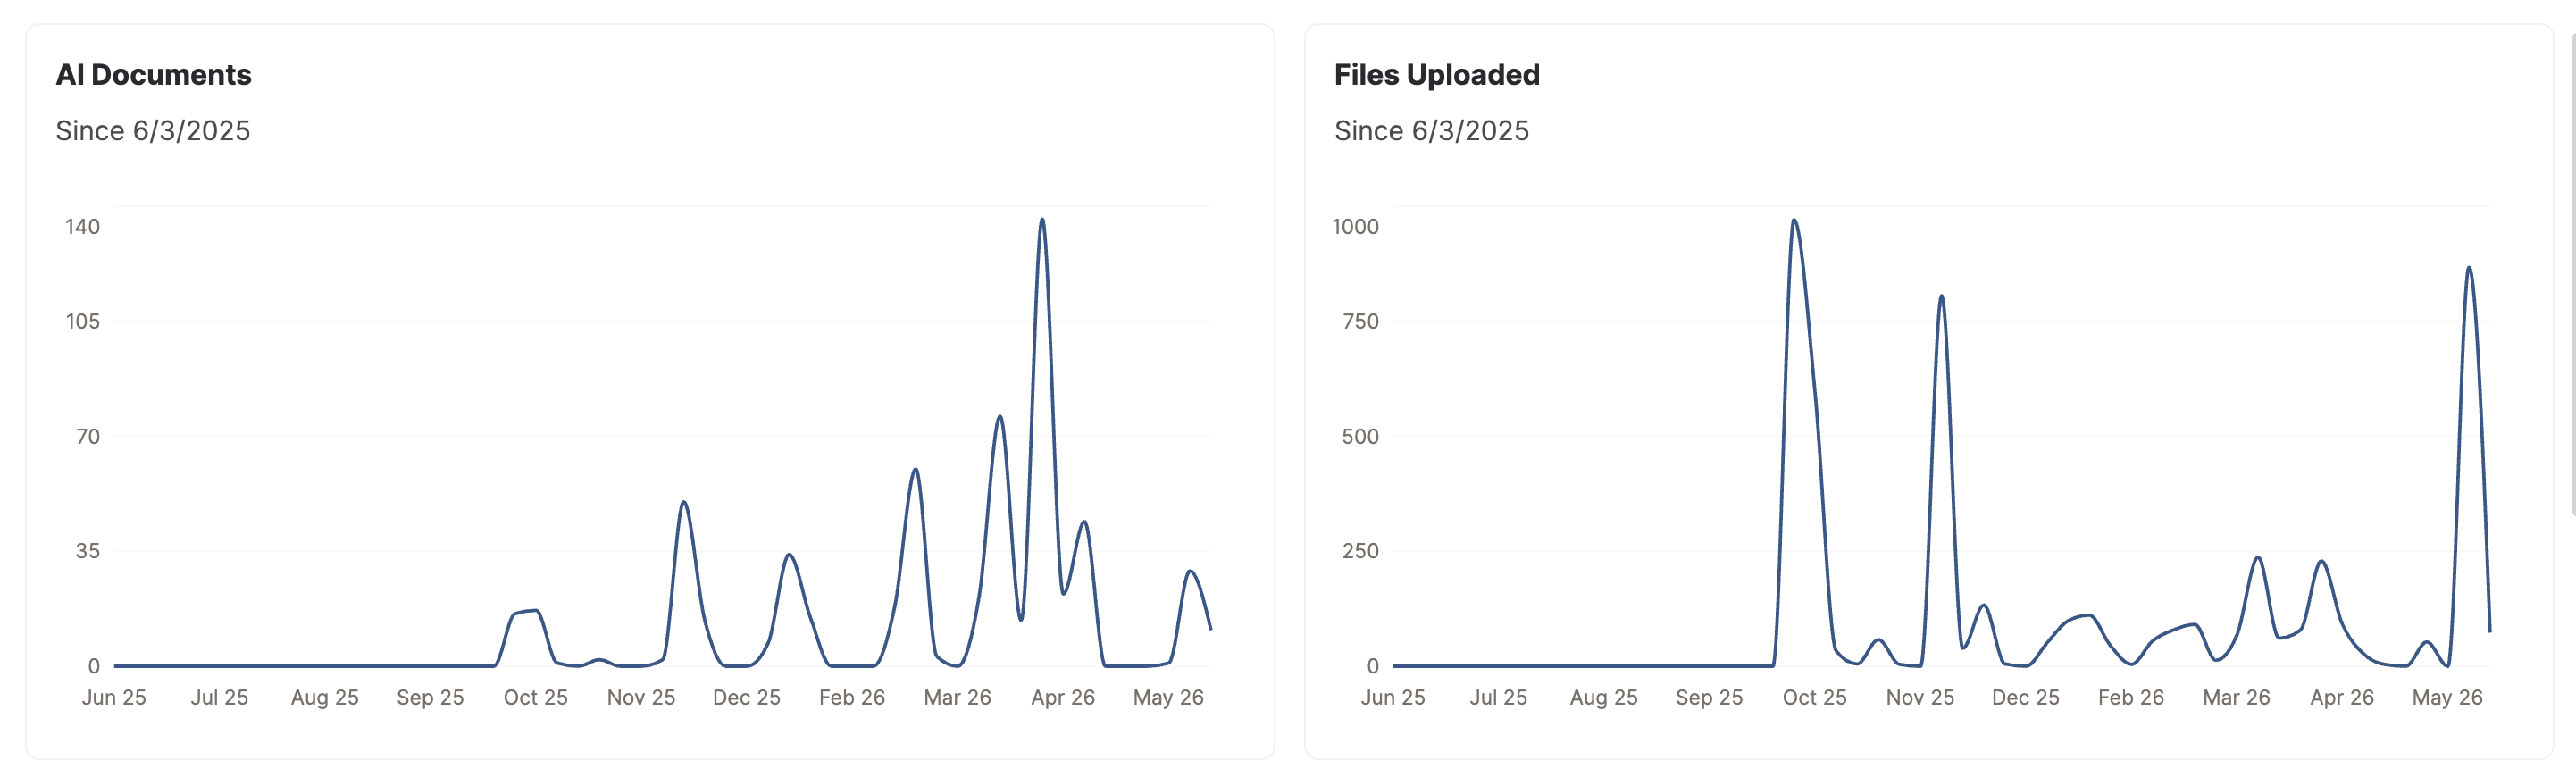
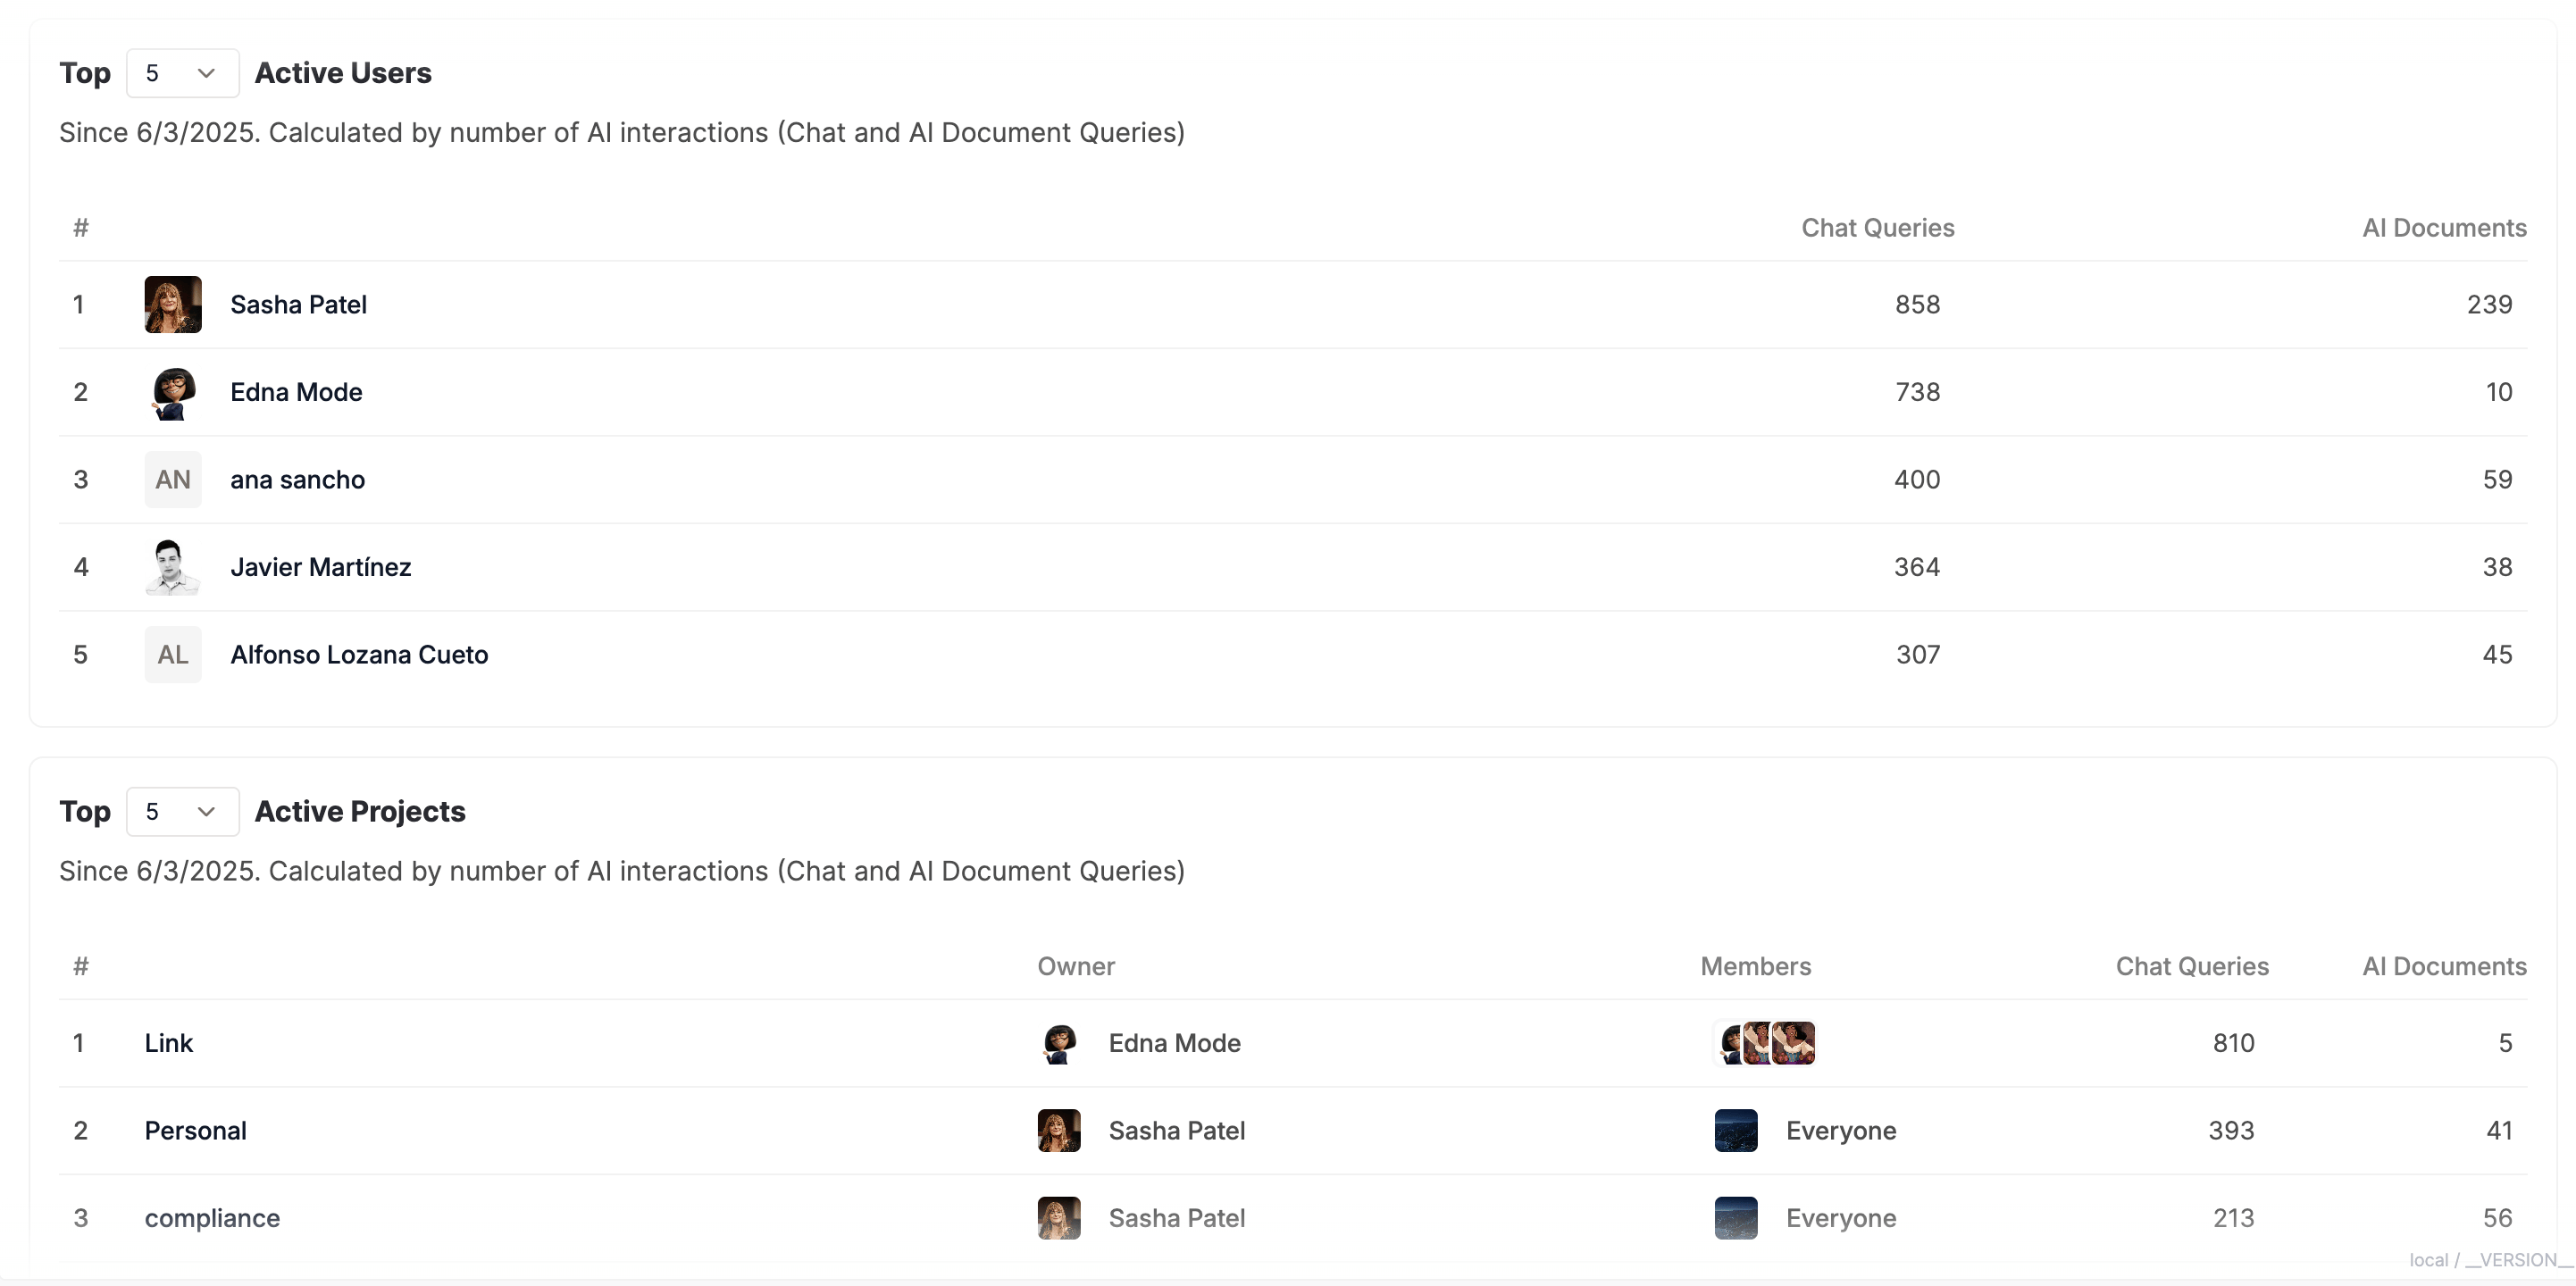
Combining Usage Dashboard with Audit Logs gives a fuller picture of adoption and behavior.
Engagement Analytics is designed to demonstrate value and support enablement—without exposing the content of individual interactions.