Monitor and manage system health, performance, and user activities with the Sys Admin Dashboard.
Upcoming release — Zylon 1.58These docs are published ahead of release so you can prepare your API integrations. The release image is not yet available. For installations running 1.57, use the 1.57 documentation.
Zylon comes with a built-in Kubernetes Dashboard,
which will help you monitor and diagnose issues with your installation.To enable it, you will need to edit your config file at /etc/zylon/zylon-conf.yaml and add the following section:
adminDashboard:
  enabled: true
  exposeIngress: true
Next, update your Zylon system by running:
sudo zylon-cli sync
Once the update completes, access the dashboard at:
https://<zylon.company.com>/kube-dashboardTo login, you can generate a short-lived token:
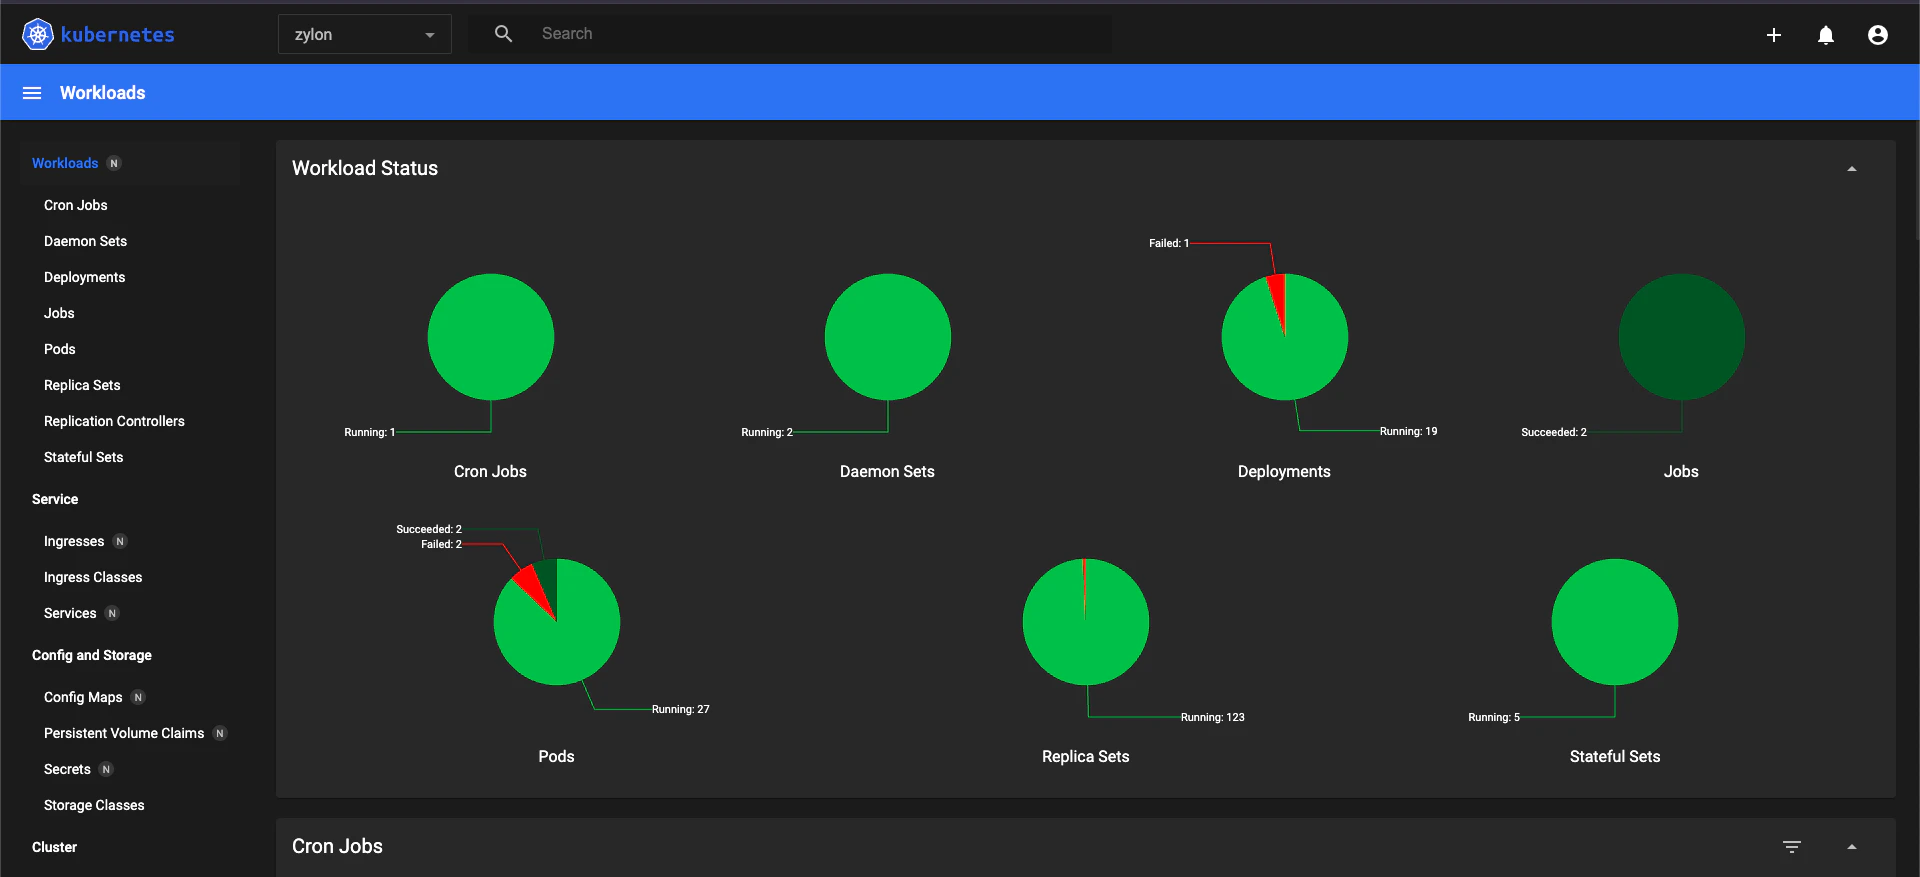
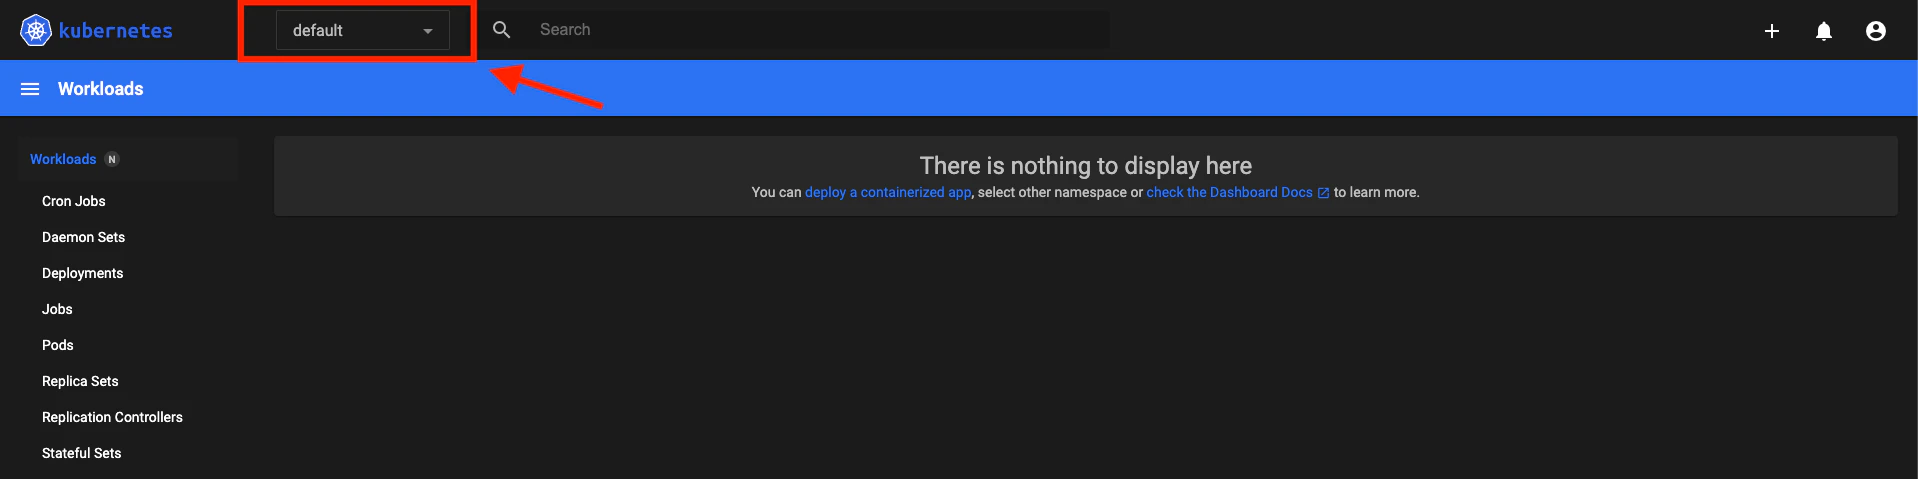
When you first open the Kubernetes Dashboard, you’ll see a high-level overview of your workloads and cluster health.
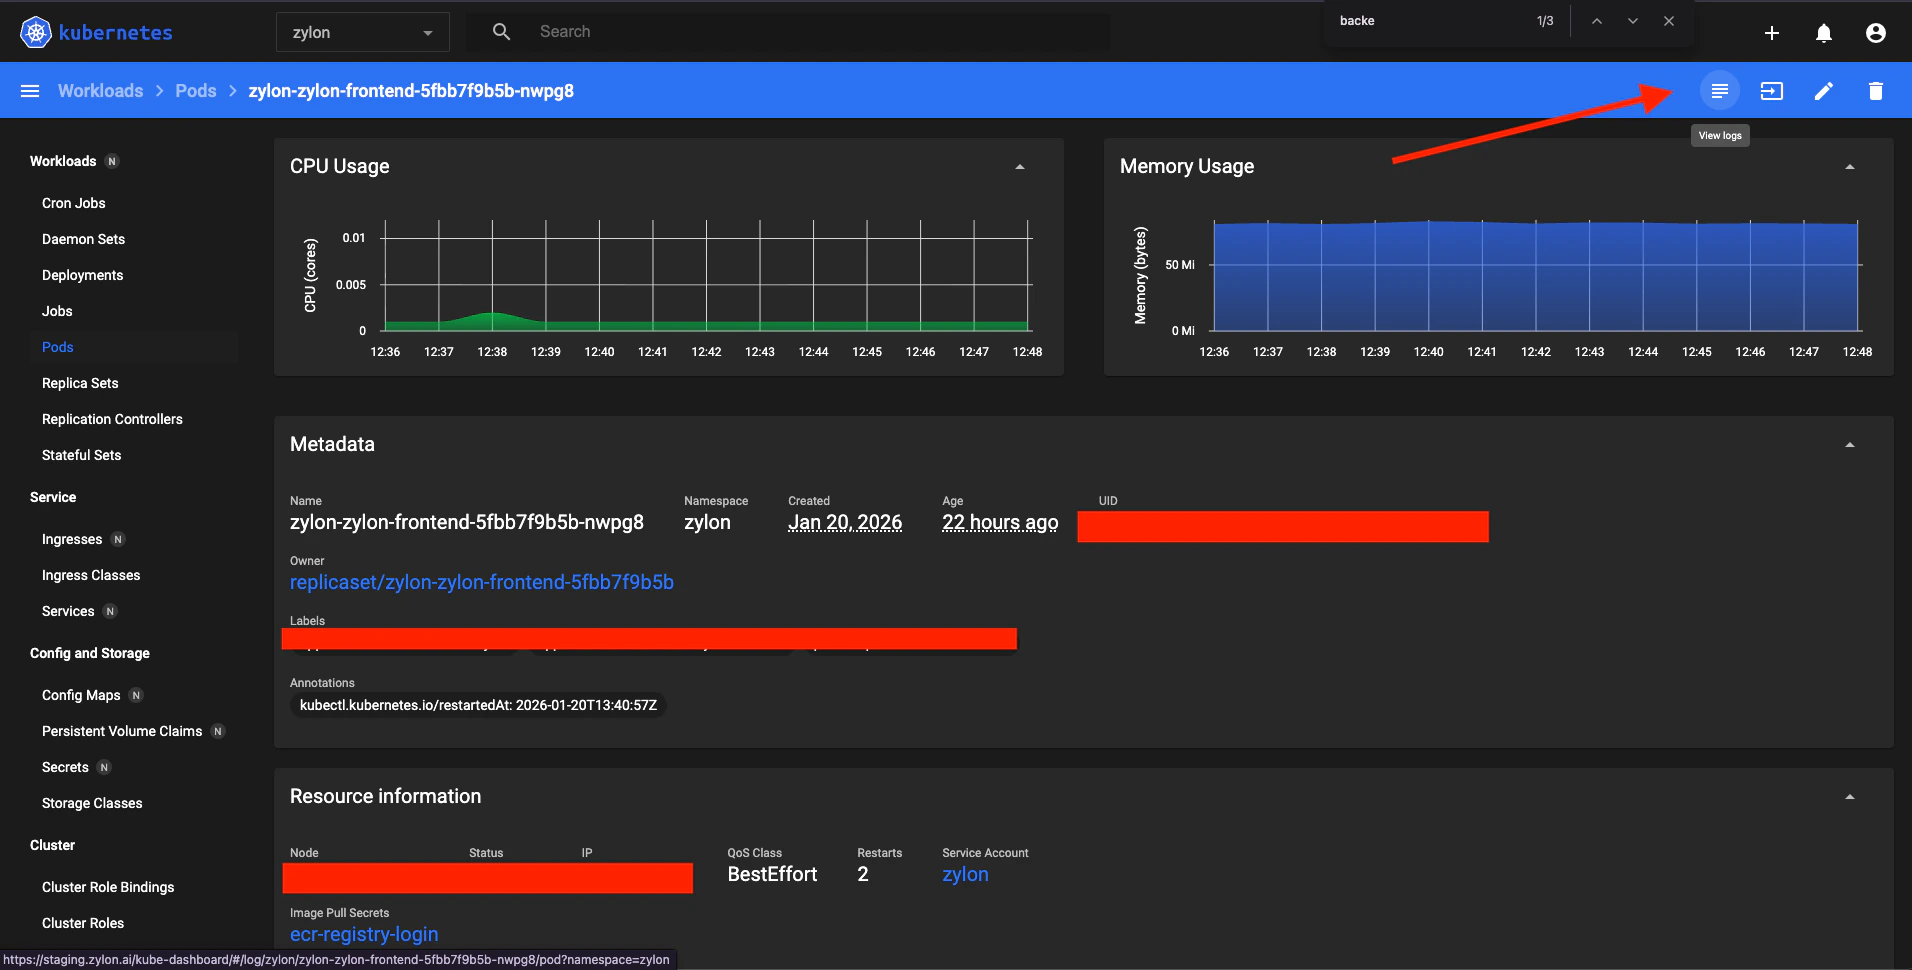
This view shows the current status of running resources such as Pods, Deployments, and basic CPU/memory usage.