> ## Documentation Index
> Fetch the complete documentation index at: https://docs.zylon.ai/llms.txt
> Use this file to discover all available pages before exploring further.
# External Grafana Dashboard
This page is for teams that use their own Grafana instance.
Zylon provides a reference dashboard for Triton and vLLM platform metrics, but importing it is a separate Grafana task. It is not required to enable observability in Zylon.
Use it when you want an external Grafana dashboard for:
* service health
* throughput and failures
* latency analysis
* scheduler and GPU bottlenecks
## What you need first
Before this dashboard is useful, you need:
* platform metrics enabled in Zylon
* a Prometheus-compatible metrics backend with Zylon metrics in it
* a Grafana instance with a Prometheus datasource connected to that backend
See [Platform Metrics](/en/operator-manual/configuration/observability/platform-metrics) and [Metrics Destinations](/en/operator-manual/configuration/observability/destinations).
## Import the dashboard
Download [grafana-dashboard.json](https://raw.githubusercontent.com/zylon-ai/zylon-docs/main/snippets/grafana-dashboard.json) and import it in your Grafana instance through **Dashboards → New → Import**.
For the Grafana import flow, see the [Grafana import dashboards documentation](https://grafana.com/docs/grafana/latest/visualizations/dashboards/build-dashboards/import-dashboards/).
## What the dashboard shows
The dashboard is built from the metrics exposed on the Triton `/metrics` endpoint:
* **Triton Inference Server** metrics such as request counts, latency, queue depth, and GPU health
* **vLLM** metrics such as scheduler state, KV cache use, token throughput, and latency histograms
## Dashboard filters
| Variable | Purpose |
| --------------- | ----------------------------------------- |
| **Datasource** | Prometheus datasource to query |
| **Environment** | Deployment or company identifier |
| **Model** | Model served by Triton |
| **GPU** | `gpu_uuid` filter for GPU-specific panels |
## Reading the dashboard
Follow this order when investigating an issue:
| Section | What it helps you answer |
| -------------------- | ----------------------------------------------------------- |
| Overview | Is the service healthy right now? |
| Throughput & Errors | How much traffic is it handling, and are requests failing? |
| Latency | Where is time being spent? |
| Capacity & Scheduler | Is the bottleneck queueing, KV cache pressure, or batching? |
| Workload Analysis | What kind of requests are clients sending? |
| GPU Health | Is the GPU saturated or memory constrained? |
| Host Resources | Is the node itself under pressure? |
## Panels by section
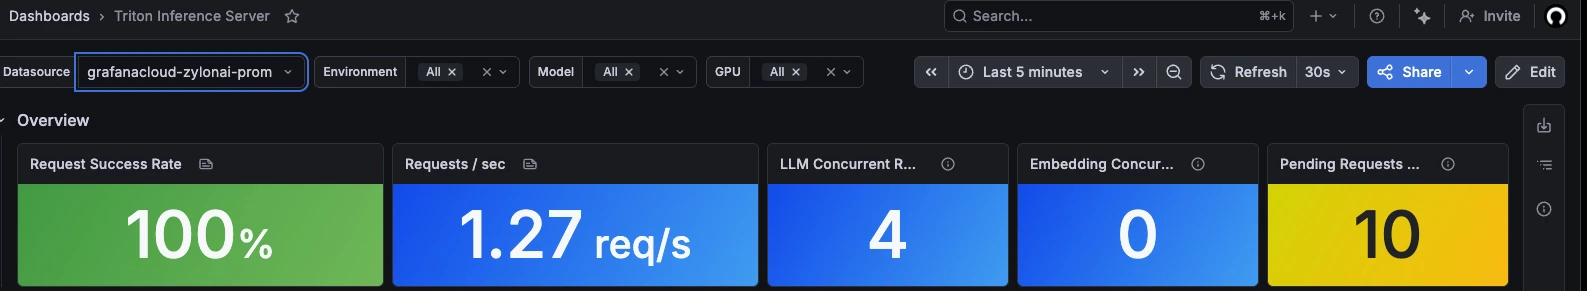
### Overview
Quick health indicators for success rate, requests per second, concurrent requests, and queue depth.
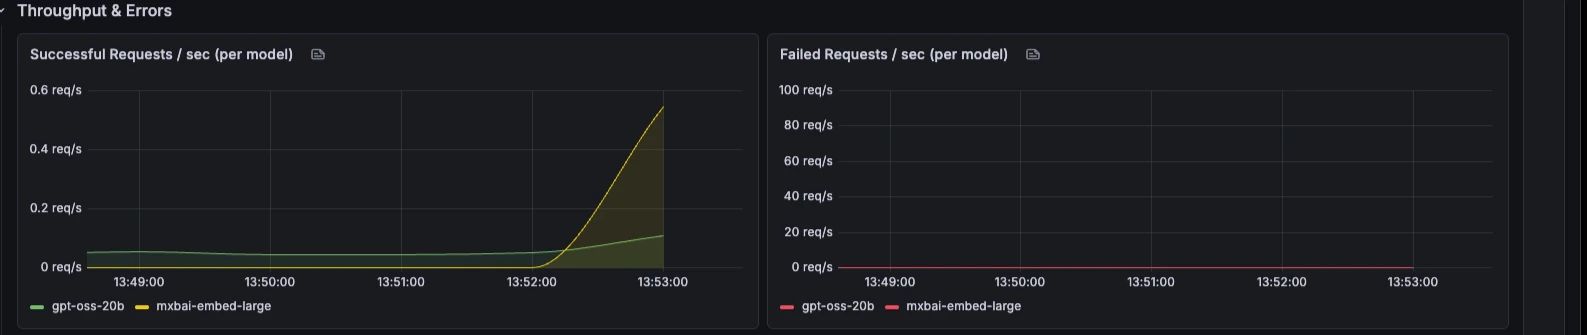
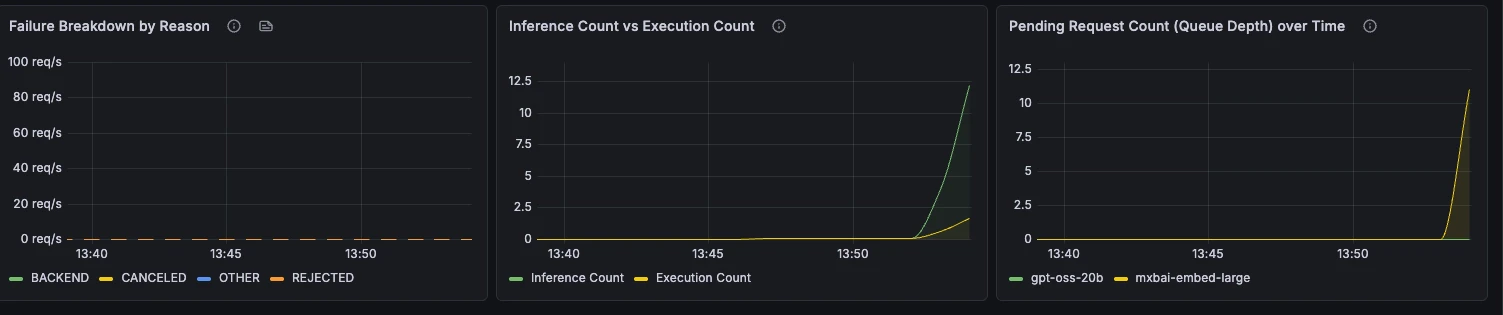
 ### Throughput & Errors
Request rate, failure rate, failure reasons, batching behaviour, and queue depth over time.
### Throughput & Errors
Request rate, failure rate, failure reasons, batching behaviour, and queue depth over time.
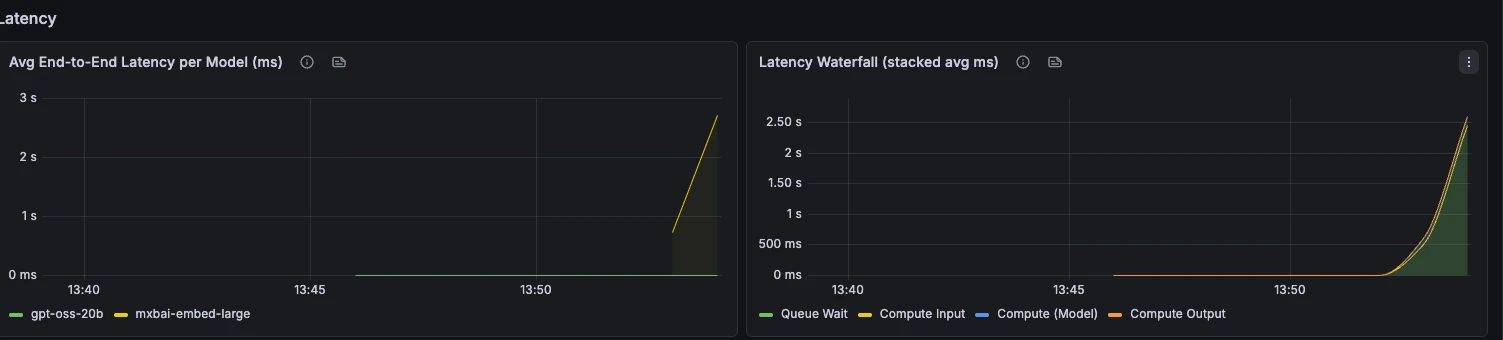
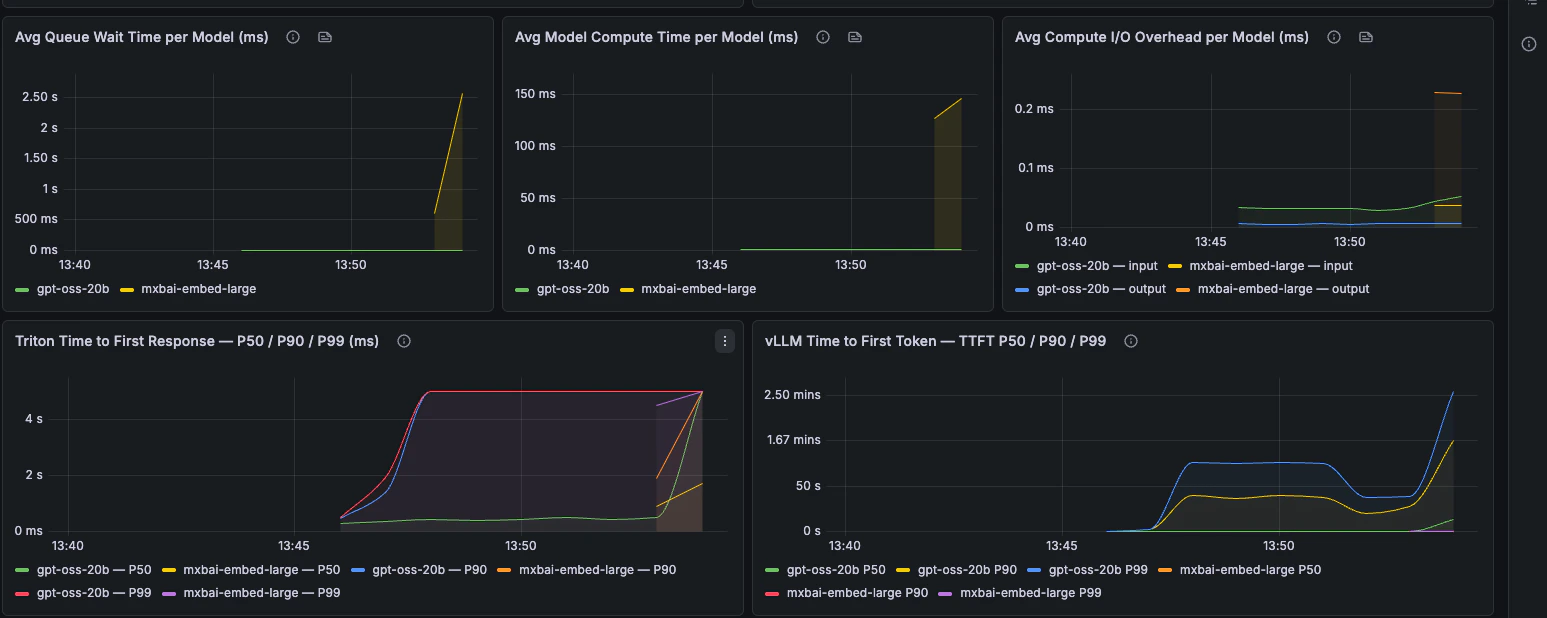
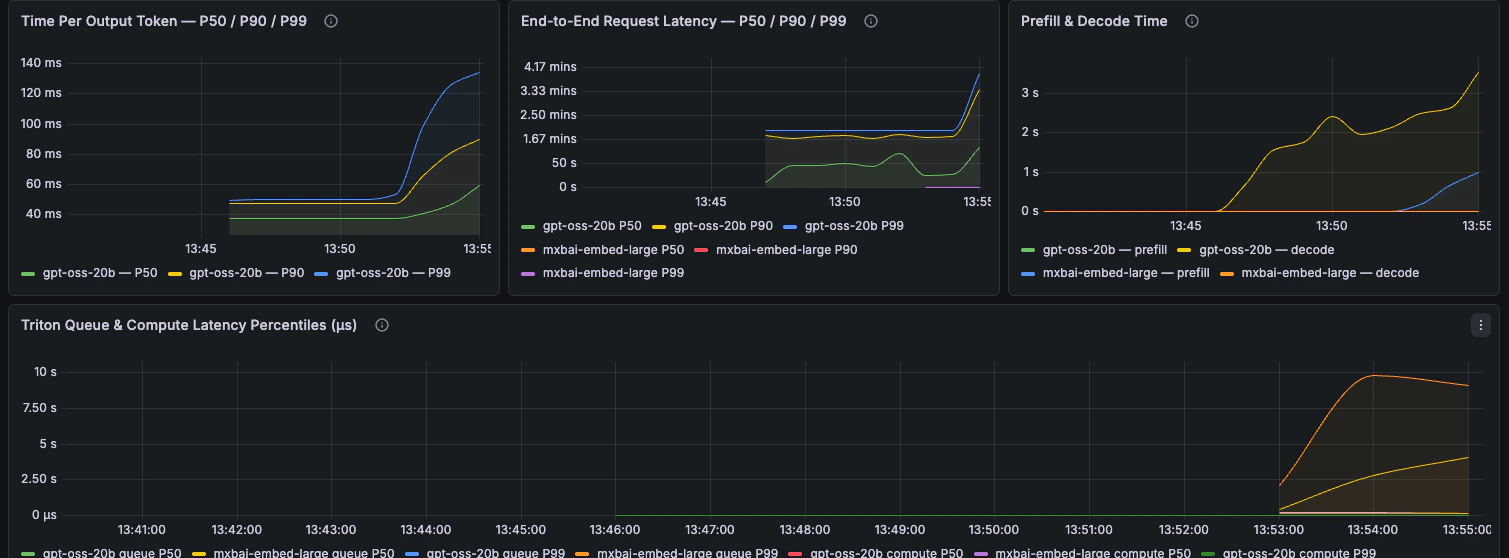
 ### Latency
End-to-end latency, phase breakdown, TTFT, TPOT, and request latency percentiles.
### Latency
End-to-end latency, phase breakdown, TTFT, TPOT, and request latency percentiles.
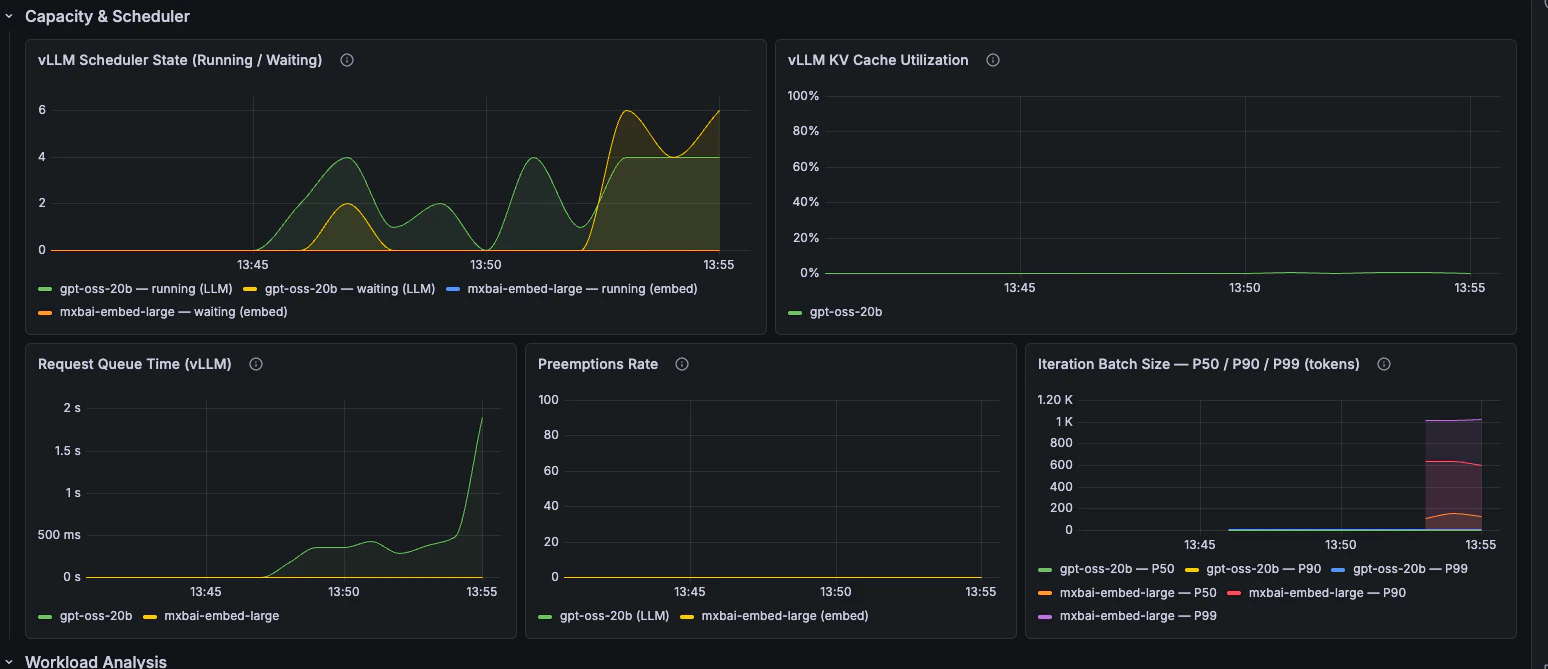
 ### Capacity & Scheduler
Scheduler state, queue time, KV cache utilisation, preemptions, and batch size.
### Capacity & Scheduler
Scheduler state, queue time, KV cache utilisation, preemptions, and batch size.
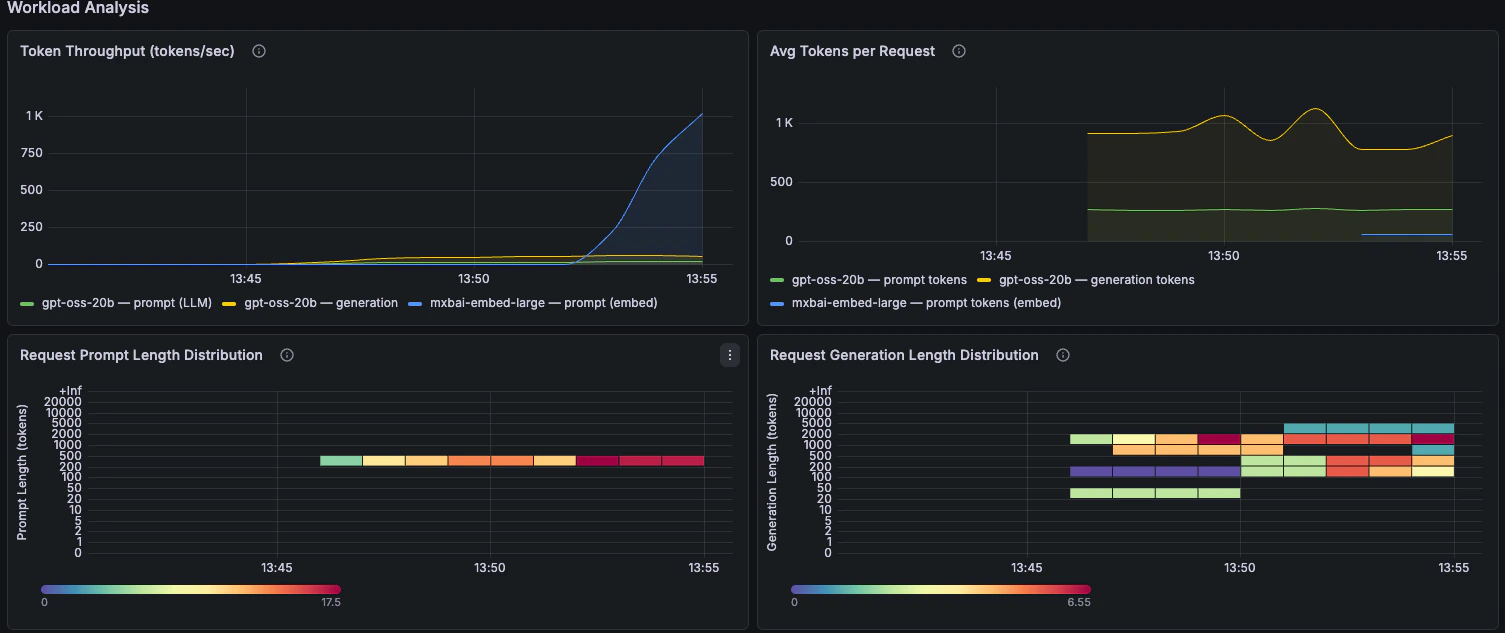
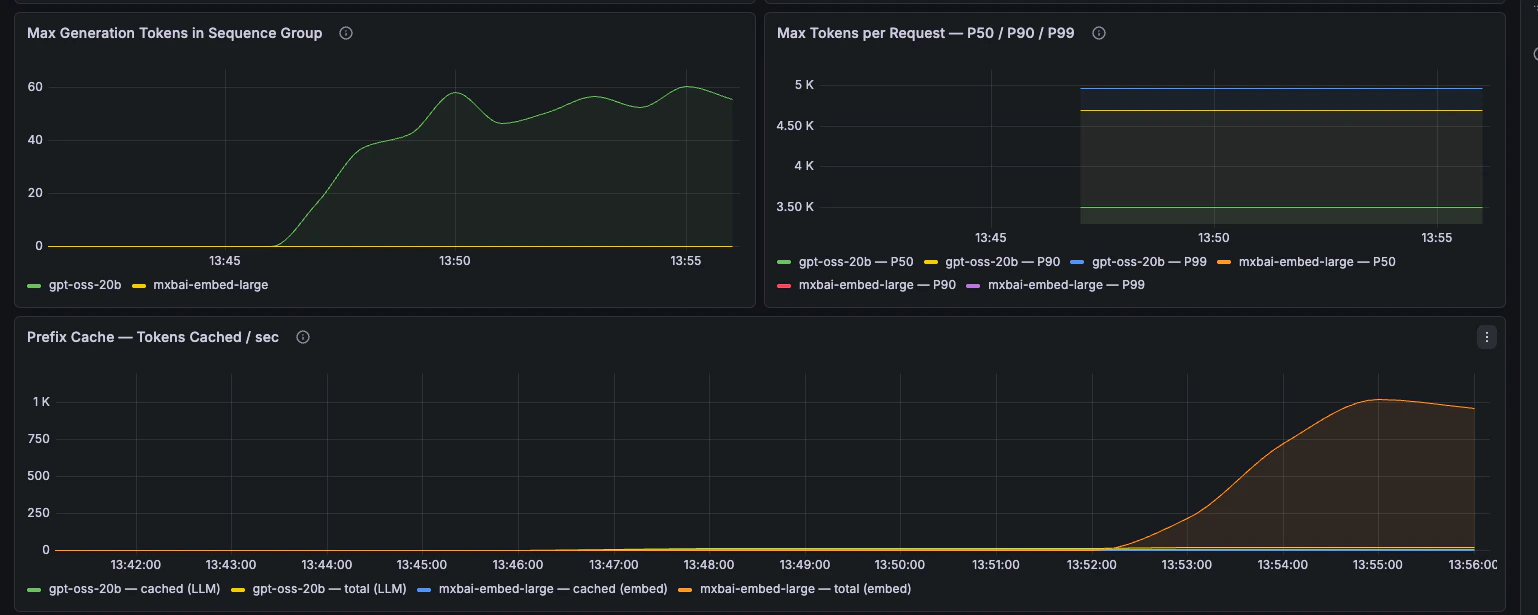
 ### Workload Analysis
Token throughput, prompt length, generation length, and prefix-cache behaviour.
### Workload Analysis
Token throughput, prompt length, generation length, and prefix-cache behaviour.
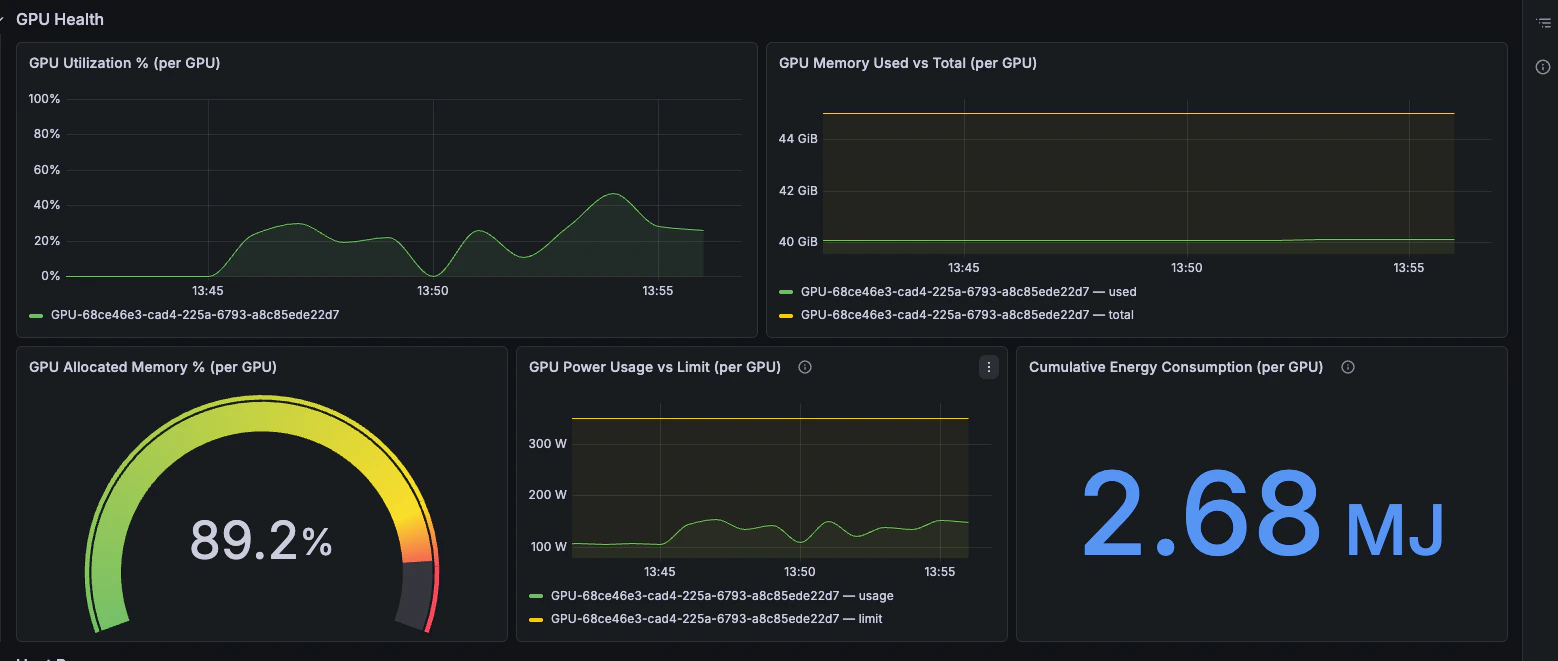
 ### GPU Health
GPU utilisation, memory pressure, power draw, and energy consumption.
### GPU Health
GPU utilisation, memory pressure, power draw, and energy consumption.
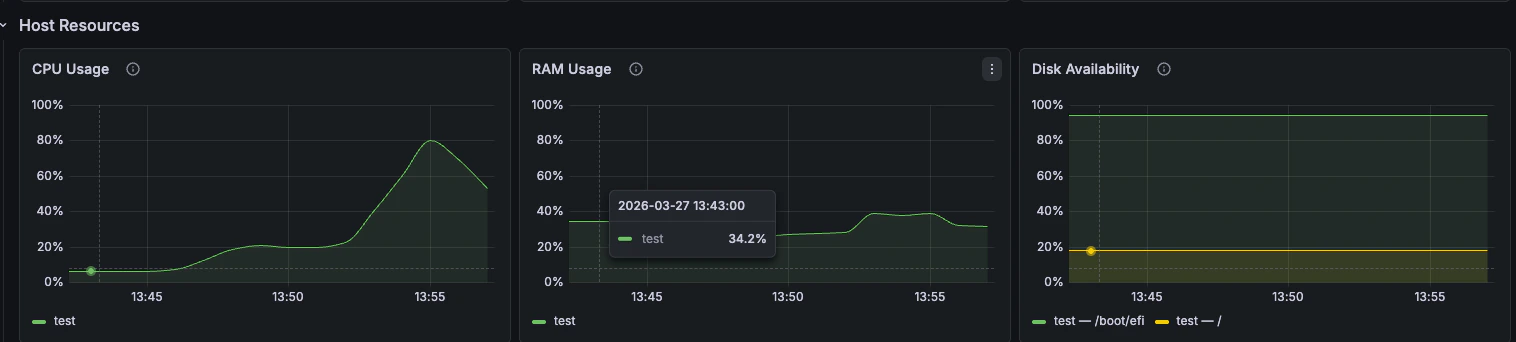
 ### Host Resources
CPU, RAM, and disk availability from `node_exporter`.
### Host Resources
CPU, RAM, and disk availability from `node_exporter`.