> ## Documentation Index
> Fetch the complete documentation index at: https://docs.zylon.ai/llms.txt
> Use this file to discover all available pages before exploring further.
# Usage Dashboard
> Monitor AI usage across gateways, API tokens, and Workspace activity.
## Overview
The Usage Dashboard gives Operators a centralized view of AI usage across the Zylon platform. It helps answer operational questions such as how much token consumption is happening, which gateways are active, and whether knowledge, file, and web-search activity is being used.
Use the dashboard when you need to:
* Monitor AI usage over time.
* Compare total usage with per-gateway usage.
* Review usage for one or more gateways.
* Inspect activity associated with API tokens.
* Understand how Workspace activity contributes to platform usage.
The dashboard is available from **Backoffice > Platform > Usage** for users with **Operator** access. Usage metrics require [Audit Log](/en/operator-manual/configuration/features/feat-audit) logging and storage to be enabled.
## Understanding usage collection
Workspace and API Token requests are routed through a Gateway. Each Gateway records the usage it handles, so the Usage Dashboard reports activity by Gateway.
Workspace requests use Workspace sessions instead of API Tokens. They appear in Gateway totals when **Keys** is set to **All tokens**, but they do not appear when filtering by a specific API Token.
 ## Available information
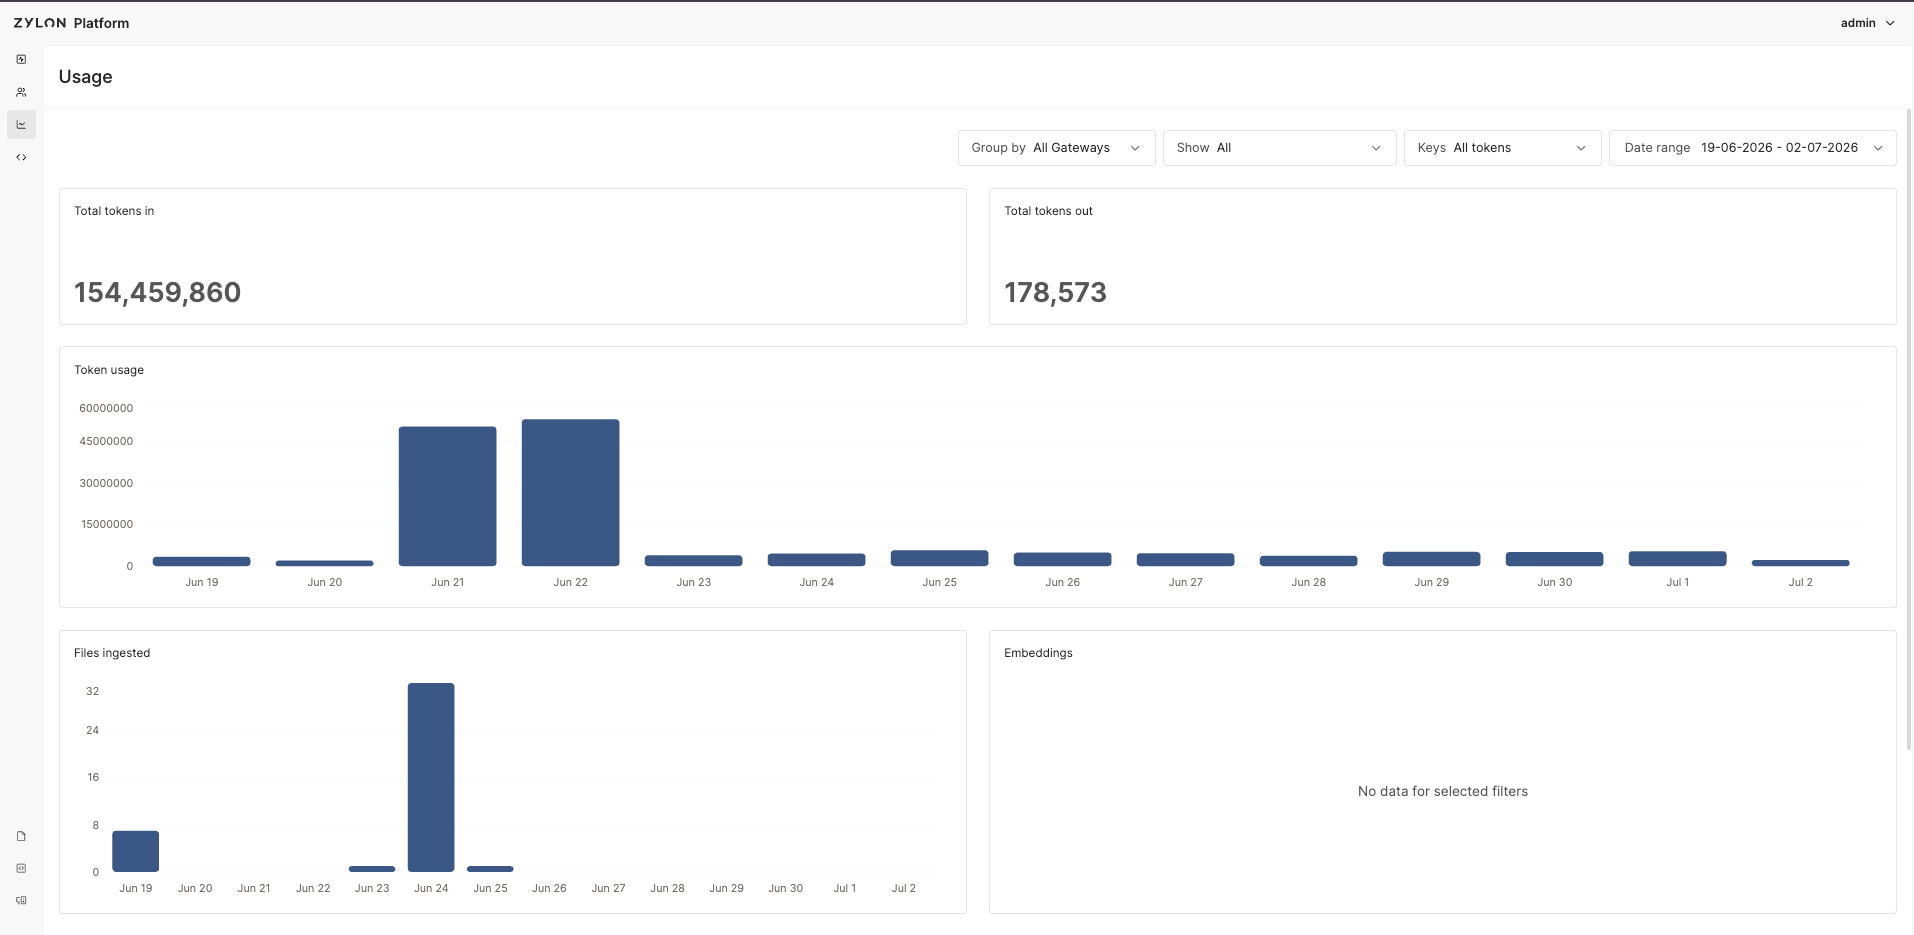
The dashboard shows summary cards and charts for the selected filters.
### Token usage metrics
**Total tokens in** is the total number of input tokens consumed by chat requests in the selected date range and Gateway scope.
Use this metric to understand the amount of user, system, and context input being sent to AI providers.
**Total tokens out** is the total number of output tokens generated by chat responses in the selected date range and Gateway scope.
Use this metric to understand how much AI-generated response content is being produced.
The **Token usage** chart shows total chat token consumption over time. It combines input and output tokens for each day in the selected date range.
When **Group by** is set to **All Gateways**, the chart shows one combined total. When **Group by** is set to **Gateways**, the chart breaks the same total into one series per selected gateway.
The **Files ingested** chart shows the number of unique files ingested over time.
This helps Operators confirm whether knowledge ingestion is happening and when ingestion activity occurred.
The **Embeddings** chart shows embedding activity over time. Each recorded embedding event is counted once.
Use this chart to understand when embedding workloads are occurring.
### Tool execution metrics
The **File searches** chart shows file-search tool usage found in chat activity.
Use this chart to understand when users or applications are asking Zylon to search available knowledge and files during AI interactions.
The **Web searches** chart shows web-search tool usage found in chat activity.
Use this chart to understand when AI interactions are using web search.
## Filters
Filter state is kept in the page URL, so a filtered view can be refreshed or shared with another authorized Backoffice user.
**Group by** controls how charts are displayed.
* **All Gateways** shows one combined total series.
* **Gateways** breaks charts down by gateway.
This filter changes chart grouping only. It does not change which usage records are included.
**Show** controls the gateway scope.
* **All** includes all available gateways.
* Selecting one or more gateways limits the dashboard to those gateways.
When **Show** changes, **Keys** resets to **All tokens**. This prevents a token selection from a previous gateway scope from remaining active after the gateway scope changes.
**Keys** filters API Token activity for the currently selected gateways.
* **All tokens** includes all usage in the selected gateway scope, including Workspace-generated usage.
* Selecting one or more API tokens shows only usage associated with those API tokens.
Workspace-generated usage is not associated with an API token. Because of that, Workspace activity appears when **Keys** is set to **All tokens**, but it does not appear when filtering by a specific API token.
**Date range** controls the time period shown by the dashboard.
Available presets are:
* **Week to date**
* **Month to date**
* **Last 7 days**
* **Last 14 days**
* **Last 30 days**
The default date range is **Last 14 days**. You can also select a custom range. Future dates are not available, and the calendar starts at **January 1, 2026**.
If a custom range is entered with the end date before the start date, Zylon normalizes the range.
## Notes and limitations
* The dashboard is read-only. It does not create, edit, or delete platform data.
* Export and download controls are not available from this dashboard.
* Filters by organization, project, user, or account email are not available.
* If no gateways are available, the dashboard shows an empty state.
* If gateways exist but no usage matches the selected filters, charts show a no-data state.
* Usage metrics depend on audit logging and storage. If storage is disabled, the dashboard cannot render usage metrics.
* The dashboard depends on stored application log data. If log records are removed by the cleanup schedule in [Cron tasks > Hard Delete](/en/operator-manual/configuration/cron-tasks/hard-delete), or by the organization's retention policy, the dashboard cannot show usage for the removed records.
* Stored usage is most useful when system clocks are synchronized across the deployment.
## Available information
The dashboard shows summary cards and charts for the selected filters.
### Token usage metrics
**Total tokens in** is the total number of input tokens consumed by chat requests in the selected date range and Gateway scope.
Use this metric to understand the amount of user, system, and context input being sent to AI providers.
**Total tokens out** is the total number of output tokens generated by chat responses in the selected date range and Gateway scope.
Use this metric to understand how much AI-generated response content is being produced.
The **Token usage** chart shows total chat token consumption over time. It combines input and output tokens for each day in the selected date range.
When **Group by** is set to **All Gateways**, the chart shows one combined total. When **Group by** is set to **Gateways**, the chart breaks the same total into one series per selected gateway.
The **Files ingested** chart shows the number of unique files ingested over time.
This helps Operators confirm whether knowledge ingestion is happening and when ingestion activity occurred.
The **Embeddings** chart shows embedding activity over time. Each recorded embedding event is counted once.
Use this chart to understand when embedding workloads are occurring.
### Tool execution metrics
The **File searches** chart shows file-search tool usage found in chat activity.
Use this chart to understand when users or applications are asking Zylon to search available knowledge and files during AI interactions.
The **Web searches** chart shows web-search tool usage found in chat activity.
Use this chart to understand when AI interactions are using web search.
## Filters
Filter state is kept in the page URL, so a filtered view can be refreshed or shared with another authorized Backoffice user.
**Group by** controls how charts are displayed.
* **All Gateways** shows one combined total series.
* **Gateways** breaks charts down by gateway.
This filter changes chart grouping only. It does not change which usage records are included.
**Show** controls the gateway scope.
* **All** includes all available gateways.
* Selecting one or more gateways limits the dashboard to those gateways.
When **Show** changes, **Keys** resets to **All tokens**. This prevents a token selection from a previous gateway scope from remaining active after the gateway scope changes.
**Keys** filters API Token activity for the currently selected gateways.
* **All tokens** includes all usage in the selected gateway scope, including Workspace-generated usage.
* Selecting one or more API tokens shows only usage associated with those API tokens.
Workspace-generated usage is not associated with an API token. Because of that, Workspace activity appears when **Keys** is set to **All tokens**, but it does not appear when filtering by a specific API token.
**Date range** controls the time period shown by the dashboard.
Available presets are:
* **Week to date**
* **Month to date**
* **Last 7 days**
* **Last 14 days**
* **Last 30 days**
The default date range is **Last 14 days**. You can also select a custom range. Future dates are not available, and the calendar starts at **January 1, 2026**.
If a custom range is entered with the end date before the start date, Zylon normalizes the range.
## Notes and limitations
* The dashboard is read-only. It does not create, edit, or delete platform data.
* Export and download controls are not available from this dashboard.
* Filters by organization, project, user, or account email are not available.
* If no gateways are available, the dashboard shows an empty state.
* If gateways exist but no usage matches the selected filters, charts show a no-data state.
* Usage metrics depend on audit logging and storage. If storage is disabled, the dashboard cannot render usage metrics.
* The dashboard depends on stored application log data. If log records are removed by the cleanup schedule in [Cron tasks > Hard Delete](/en/operator-manual/configuration/cron-tasks/hard-delete), or by the organization's retention policy, the dashboard cannot show usage for the removed records.
* Stored usage is most useful when system clocks are synchronized across the deployment.