> ## Documentation Index
> Fetch the complete documentation index at: https://docs.zylon.ai/llms.txt
> Use this file to discover all available pages before exploring further.
# System Monitor
> Monitor live host resources and model-serving load from Backoffice.
## Overview
System Monitor gives Operators a live view of host-resource pressure and AI model-serving activity. Use it to spot CPU, memory, disk, GPU, or inference-queue pressure while the platform is running.
The page is available from **Backoffice > Platform > System Monitor** when the [System Monitor feature](/en/operator-manual/configuration/features/feat-system-monitor) is enabled.
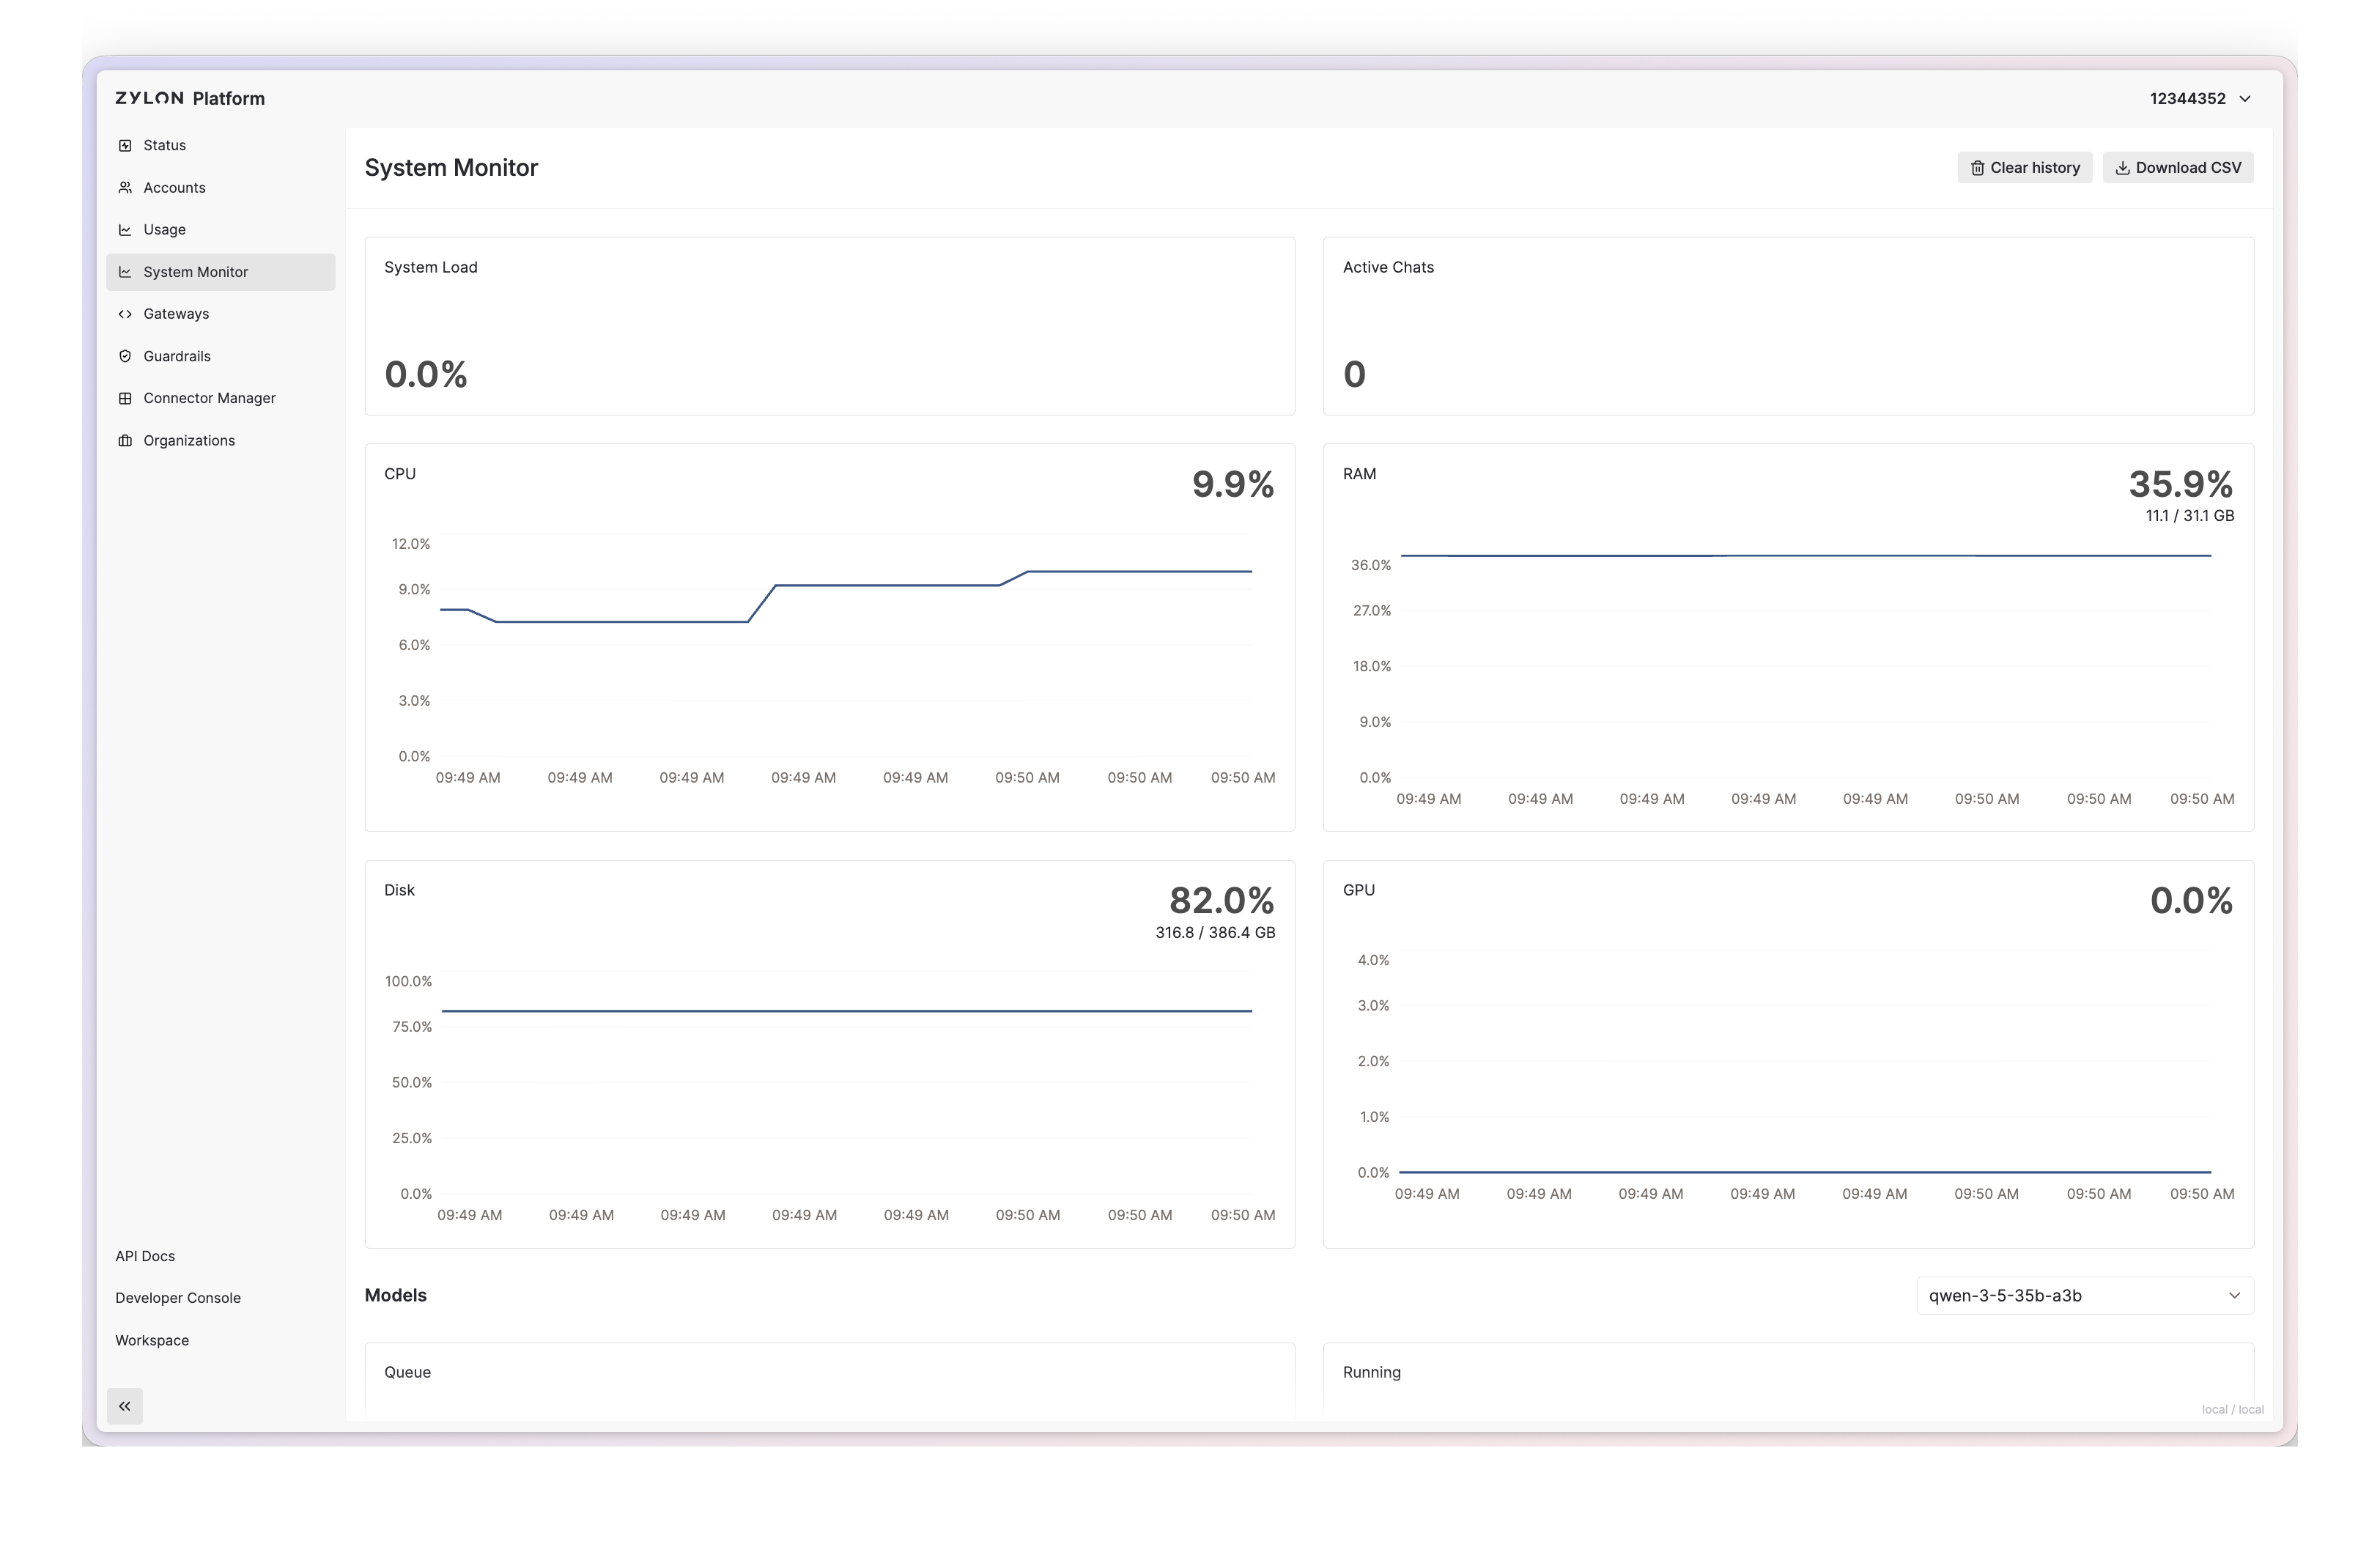 The exact layout can vary between Zylon versions.
## Available information
Metrics update once per second. Charts keep the latest 30 samples, including recent samples replayed when the page opens.
### System metrics
| Metric | What it shows |
| - | - |
| **System Load** | The highest normalized pressure across GPU, inference requests, CPU, and RAM. GPU reaches full pressure at 80%; running plus queued requests at 60; CPU and RAM contribute when usage exceeds 95%. |
| **Active Inferences** | Chat inferences currently being processed across the platform. |
| **Disk** | Used percentage and total capacity of the filesystem that stores Zylon data. |
| **CPU** | Current host CPU usage and its recent history. |
| **GPU** | Current overall GPU compute usage and its recent history. |
| **RAM** | Current host memory usage, used and total GB, and recent history. |
| **VRAM** | Current GPU-memory usage across all GPUs, used and total GB, and recent history. |
### Model metrics
Select a loaded model to inspect:
| Metric | What it shows |
| - | - |
| **Queue Inferences** | Requests waiting in Triton or in the model backend scheduler. |
| **Running Inferences** | Requests currently running in the model backend. |
| **Tokens/sec** | Output-token generation rate calculated between consecutive samples. |
| **GPU Memory Usage** | VRAM allocated to the selected model, as a percentage of total VRAM. |
| **GPU Compute** | GPU compute-core usage attributed to the selected model. |
| **GPU Memory Bandwidth** | GPU memory-bus utilization attributed to the selected model; this is different from allocated VRAM. |
## Data sources and limitations
* CPU and RAM come from Kubernetes node metrics when available, with host-level readings as a fallback.
* Disk usage covers the filesystem containing `/var/zylon`.
* GPU, VRAM, and model-serving data come from the Triton Prometheus metrics endpoint.
* Per-model GPU metrics depend on process-level GPU metrics. Deployments that do not expose them show zero values.
* The page is a live operational view, not persistent historical reporting. Reloading it requests the latest available samples again.
* System Load is an instantaneous display signal. Request-overload protection additionally considers sustained resource usage and deployment thresholds.
This documentation is built and hosted on [Mintlify](https://mintlify.com), a developer documentation platform.
The exact layout can vary between Zylon versions.
## Available information
Metrics update once per second. Charts keep the latest 30 samples, including recent samples replayed when the page opens.
### System metrics
| Metric | What it shows |
| - | - |
| **System Load** | The highest normalized pressure across GPU, inference requests, CPU, and RAM. GPU reaches full pressure at 80%; running plus queued requests at 60; CPU and RAM contribute when usage exceeds 95%. |
| **Active Inferences** | Chat inferences currently being processed across the platform. |
| **Disk** | Used percentage and total capacity of the filesystem that stores Zylon data. |
| **CPU** | Current host CPU usage and its recent history. |
| **GPU** | Current overall GPU compute usage and its recent history. |
| **RAM** | Current host memory usage, used and total GB, and recent history. |
| **VRAM** | Current GPU-memory usage across all GPUs, used and total GB, and recent history. |
### Model metrics
Select a loaded model to inspect:
| Metric | What it shows |
| - | - |
| **Queue Inferences** | Requests waiting in Triton or in the model backend scheduler. |
| **Running Inferences** | Requests currently running in the model backend. |
| **Tokens/sec** | Output-token generation rate calculated between consecutive samples. |
| **GPU Memory Usage** | VRAM allocated to the selected model, as a percentage of total VRAM. |
| **GPU Compute** | GPU compute-core usage attributed to the selected model. |
| **GPU Memory Bandwidth** | GPU memory-bus utilization attributed to the selected model; this is different from allocated VRAM. |
## Data sources and limitations
* CPU and RAM come from Kubernetes node metrics when available, with host-level readings as a fallback.
* Disk usage covers the filesystem containing `/var/zylon`.
* GPU, VRAM, and model-serving data come from the Triton Prometheus metrics endpoint.
* Per-model GPU metrics depend on process-level GPU metrics. Deployments that do not expose them show zero values.
* The page is a live operational view, not persistent historical reporting. Reloading it requests the latest available samples again.
* System Load is an instantaneous display signal. Request-overload protection additionally considers sustained resource usage and deployment thresholds.
This documentation is built and hosted on [Mintlify](https://mintlify.com), a developer documentation platform.